


Fig. 6
Download original image
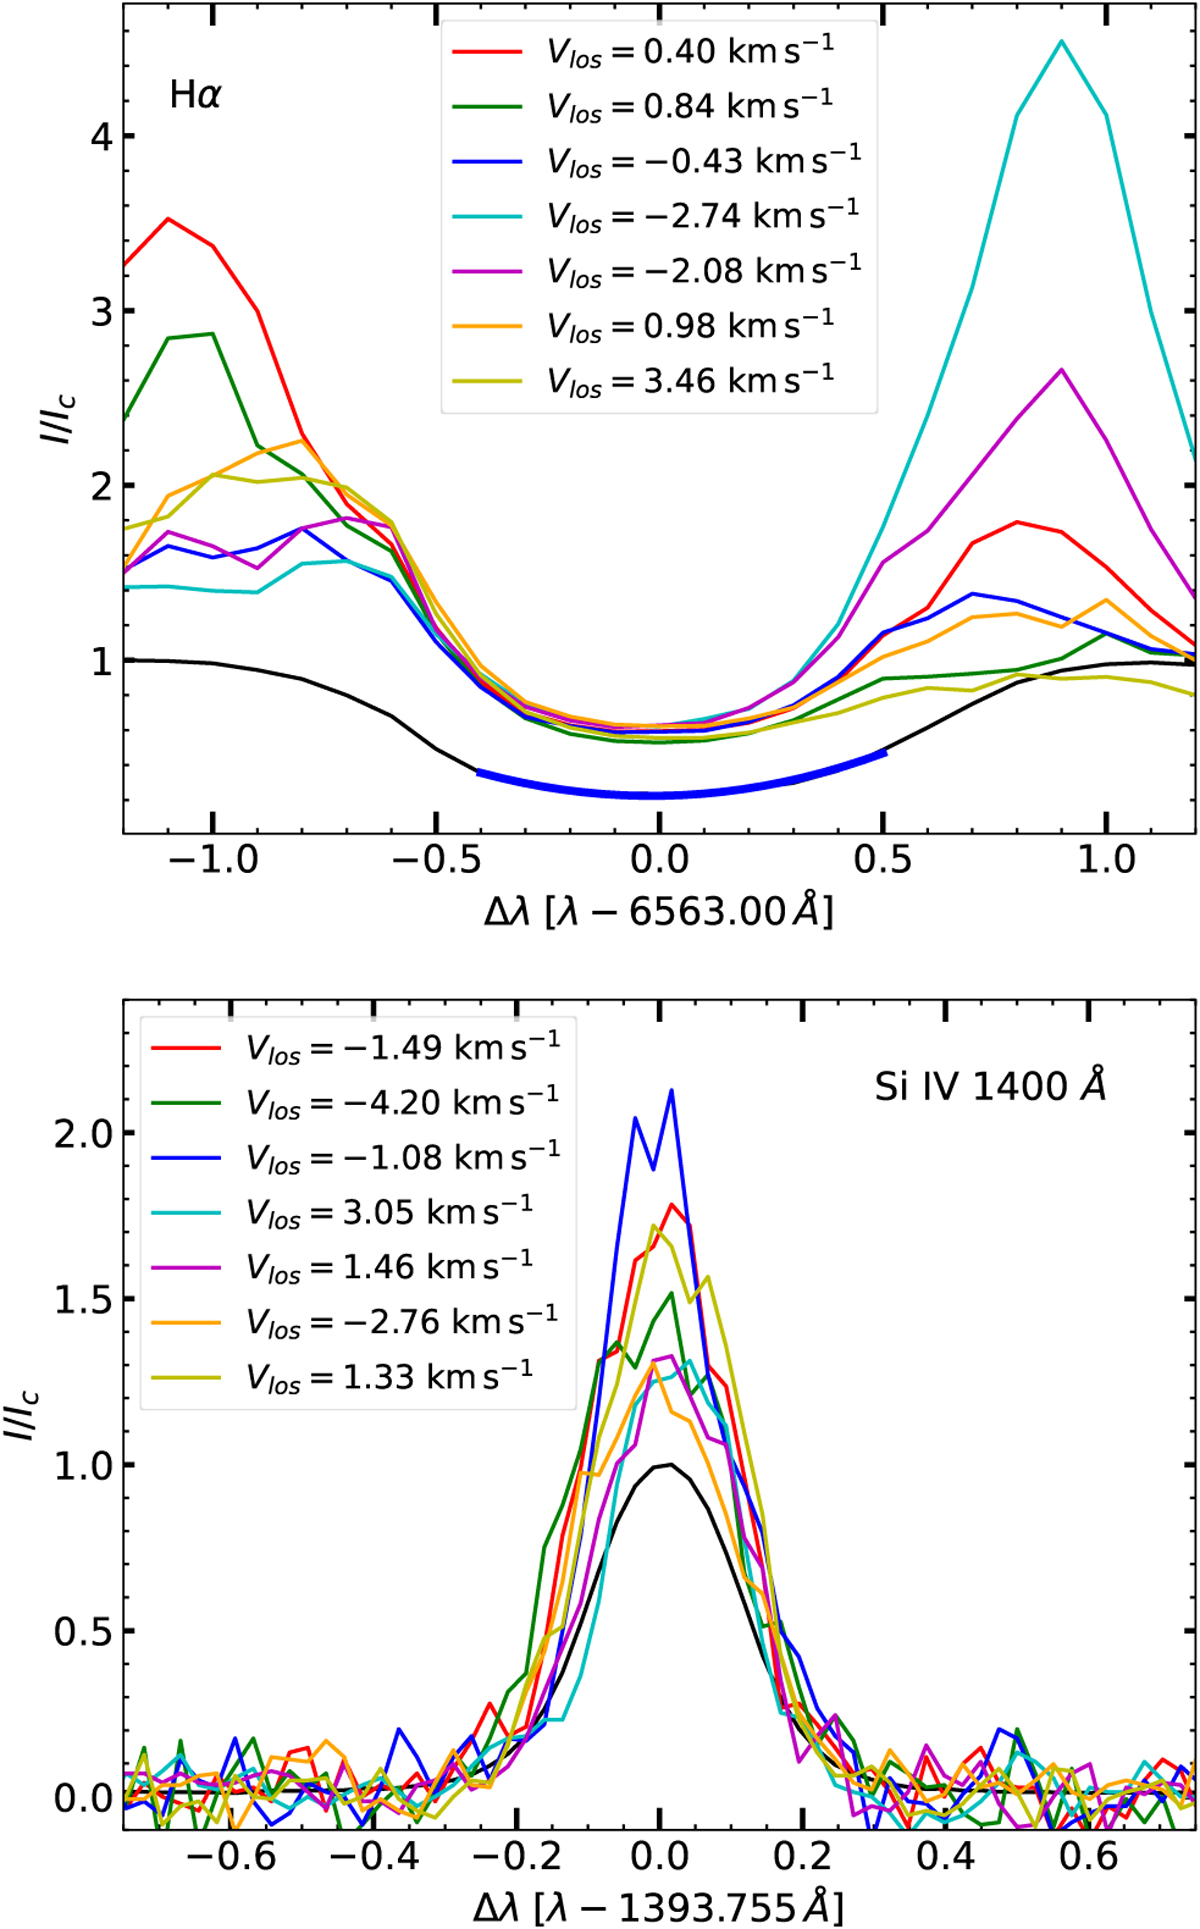
Observed spectral profiles at the seven selected locations marked in Fig. 5. Top: SST Hα line profiles. Bottom: corresponding IRIS Si IV 1400 Å line profiles. The black curve in each panel represents the reference average profile used for estimating the relative Doppler shifts. In the upper panel, the thick blue curve overplotted on the average Hα profile indicates the quadratic (parabolic) fit used to determine the line-center position, where the minimum of the fitted parabola is taken to estimate the Doppler shift of the Hα line. The different colored curves represent the spectra at the seven selected spatial locations, with the corresponding line-of-sight Doppler velocities indicated in the legends.
Current usage metrics show cumulative count of Article Views (full-text article views including HTML views, PDF and ePub downloads, according to the available data) and Abstracts Views on Vision4Press platform.
Data correspond to usage on the plateform after 2015. The current usage metrics is available 48-96 hours after online publication and is updated daily on week days.
Initial download of the metrics may take a while.