


Fig. 5
Download original image
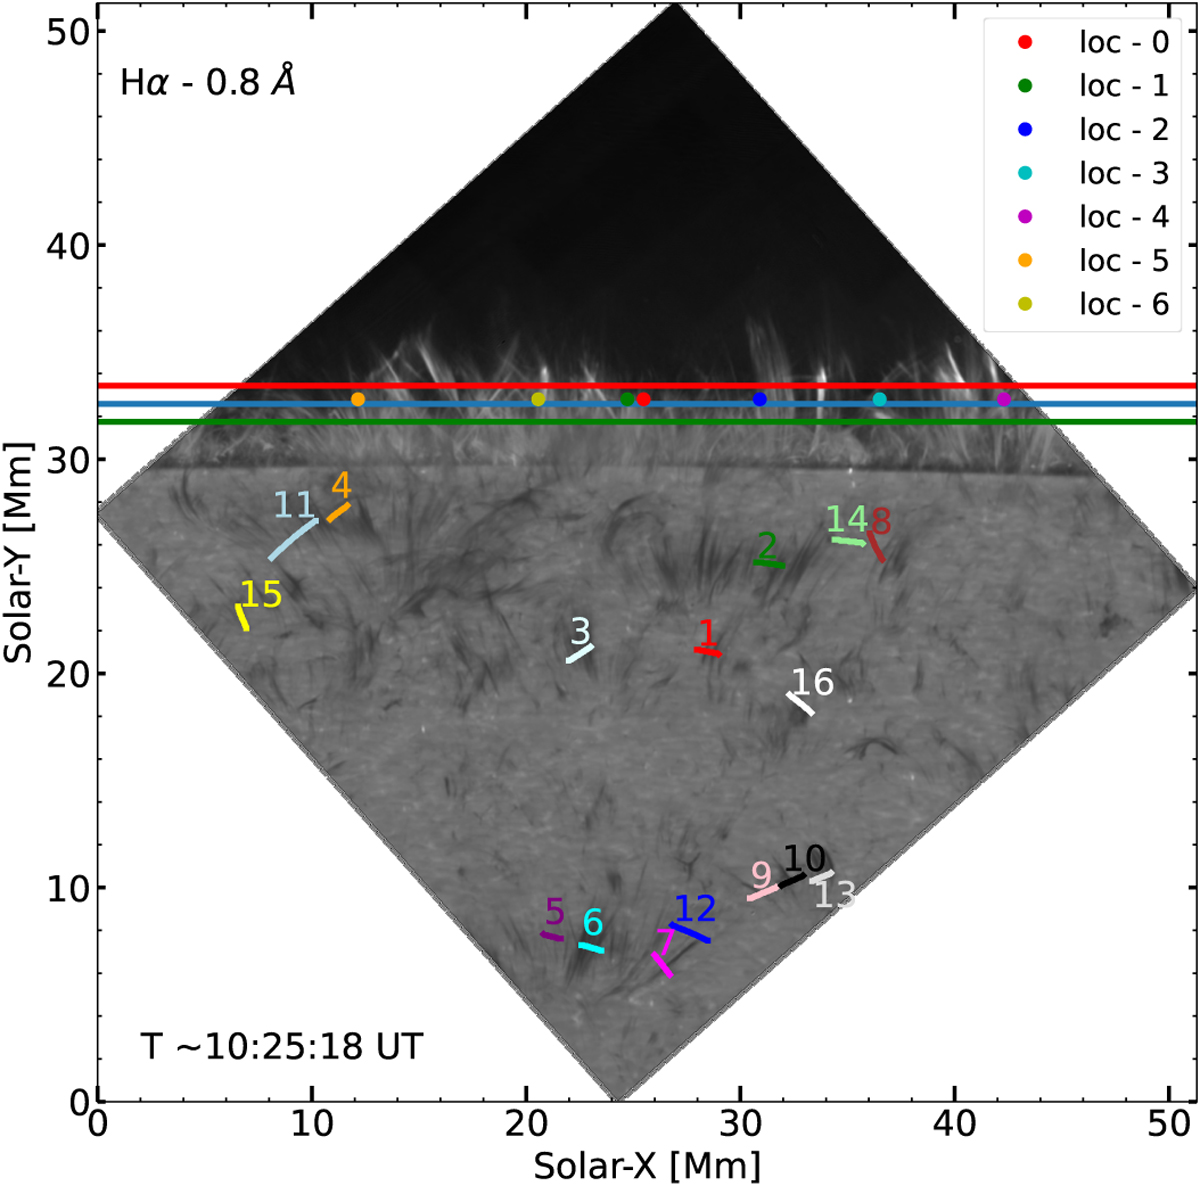
Context image showing the locations of the 16 virtual slits used to investigate transverse waves in spicules (numbered and marked by colored segments), whose space-time diagrams are presented in Fig. 8. The horizontal blue line indicates the position of the IRIS spectrograph slit. The seven colored circles mark the selected locations along the IRIS slit where the IRIS spectra are compared with the SST Hα spectra (see Fig. 6) and used for the wavelet analysis (see Fig. 7). The horizontal green and red lines indicate positions approximately 0.84 Mm below and above the IRIS slit, respectively. The background image is an SST Hα −0.8 Å map at the reference time indicated in the lower-left corner.
Current usage metrics show cumulative count of Article Views (full-text article views including HTML views, PDF and ePub downloads, according to the available data) and Abstracts Views on Vision4Press platform.
Data correspond to usage on the plateform after 2015. The current usage metrics is available 48-96 hours after online publication and is updated daily on week days.
Initial download of the metrics may take a while.