


Fig. 3
Download original image
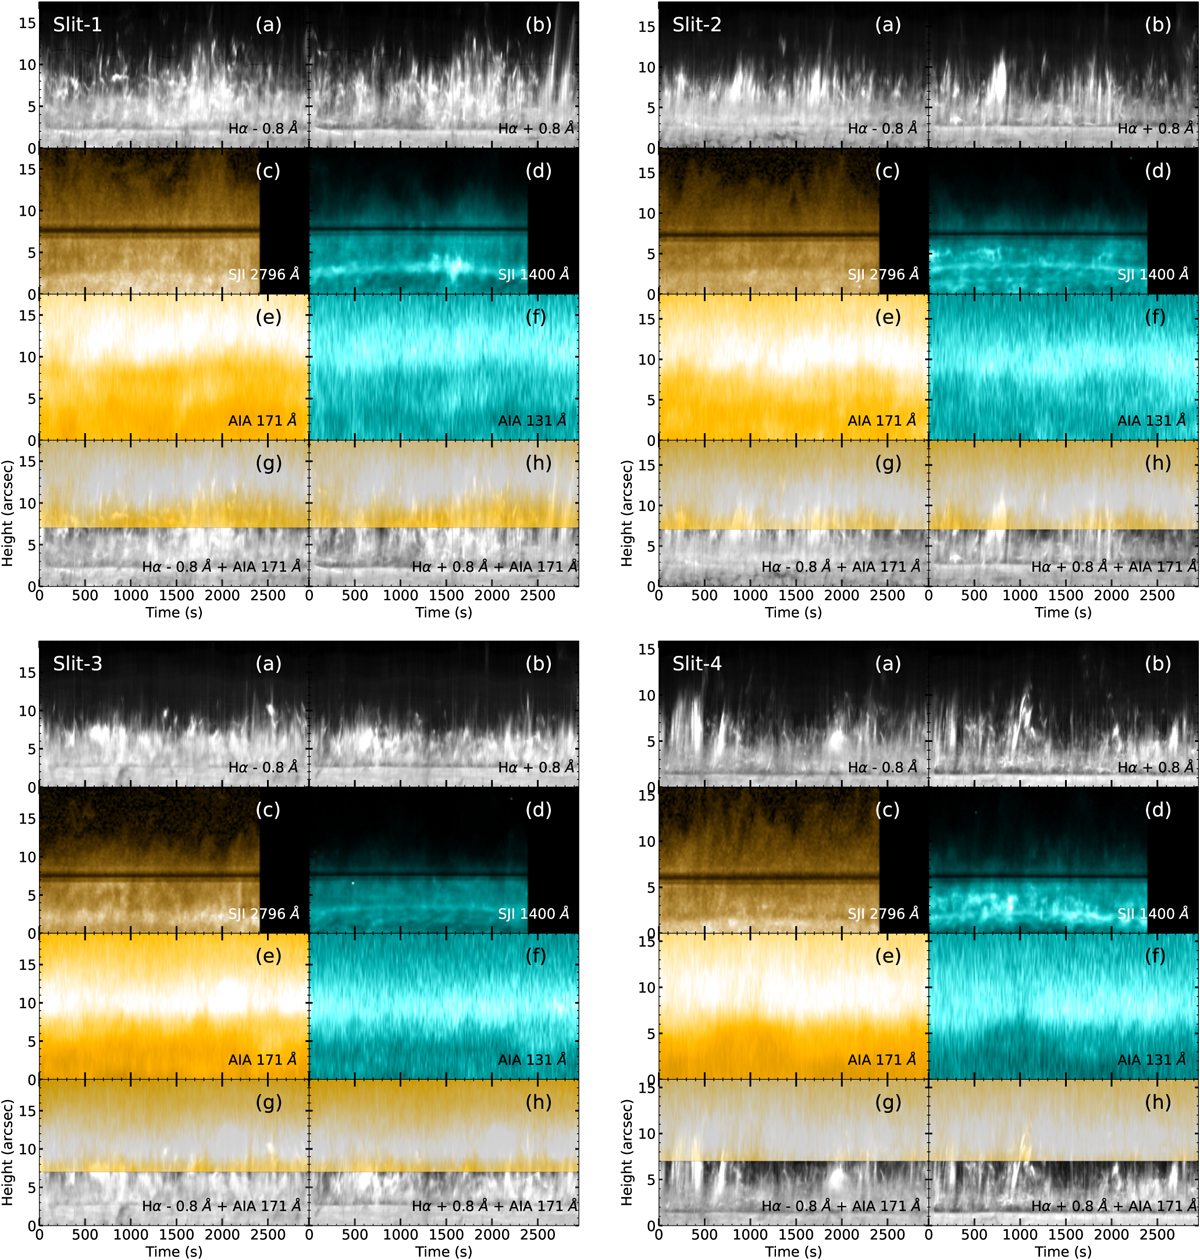
Multi-thermal space-time maps constructed along four different slits (see Fig. 1) using coordinated SST, IRIS, and SDO observations, illustrating the temporal and spatial evolution of plasma across different layers of the solar atmosphere. Top row (each example): SST Hα −0.8 Å (left) and Hα +0.8 Å (right) wing maps, sampling the lower chromosphere and revealing numerous upward-propagating jet-like structures. Second row: IRIS SJI 2796 Å (left) and SJI 1400 Å (right) maps, representing the upper chromosphere and transition region, respectively. Third row: corresponding coronal emission observed in the SDO/AIA 171 Å (left) and 131 Å (right) channels. Bottom row: composite maps formed by overlaying Hα −0.8 Å with AIA 171 Å (left) and Hα +0.8 Å with AIA 171 Å (right), highlighting the temporal and spatial correspondence between chromospheric jets and their coronal counterparts. The horizontal axis represents time, while the vertical axis shows the projected height along the slit.
Current usage metrics show cumulative count of Article Views (full-text article views including HTML views, PDF and ePub downloads, according to the available data) and Abstracts Views on Vision4Press platform.
Data correspond to usage on the plateform after 2015. The current usage metrics is available 48-96 hours after online publication and is updated daily on week days.
Initial download of the metrics may take a while.