


Fig. 2
Download original image
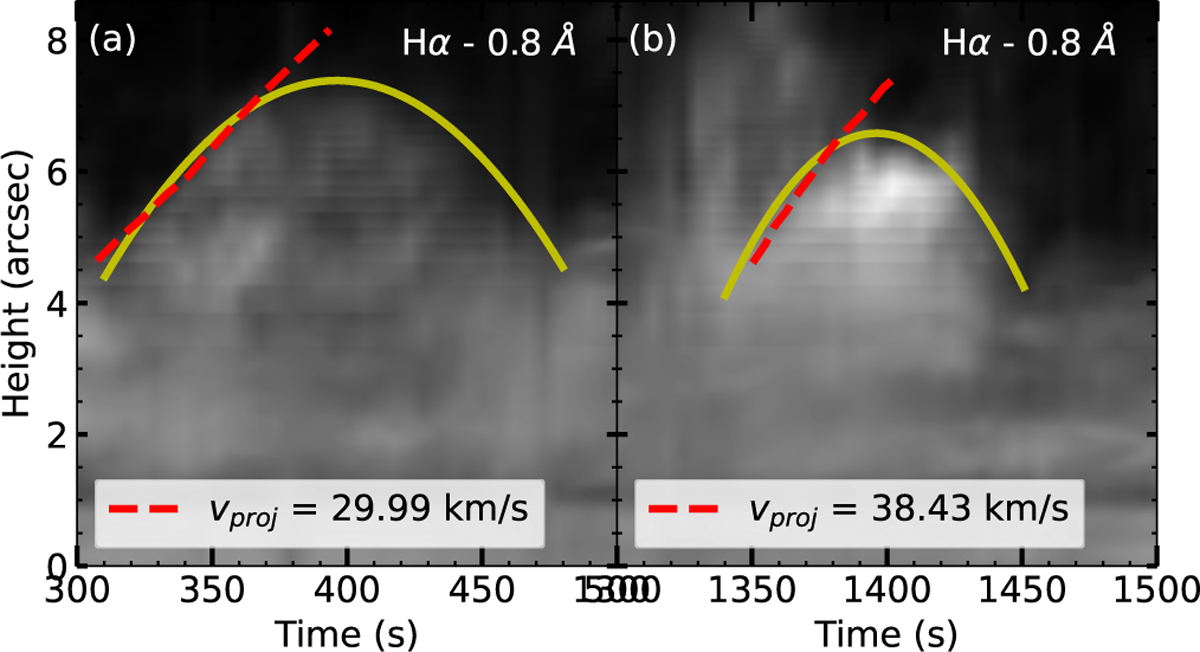
Representative examples of limb spicules exhibiting parabolic trajectories in the Hα - 0.8 Å space-time diagrams for the green slit shown in Fig. 1. The yellow curves indicate parabolic fits tracing the temporal evolution of the spicule apex, while the dashed red lines represent linear fits to the initial upward phase used to estimate the projected upward velocity (vproj).
Current usage metrics show cumulative count of Article Views (full-text article views including HTML views, PDF and ePub downloads, according to the available data) and Abstracts Views on Vision4Press platform.
Data correspond to usage on the plateform after 2015. The current usage metrics is available 48-96 hours after online publication and is updated daily on week days.
Initial download of the metrics may take a while.