


Fig. 1
Download original image
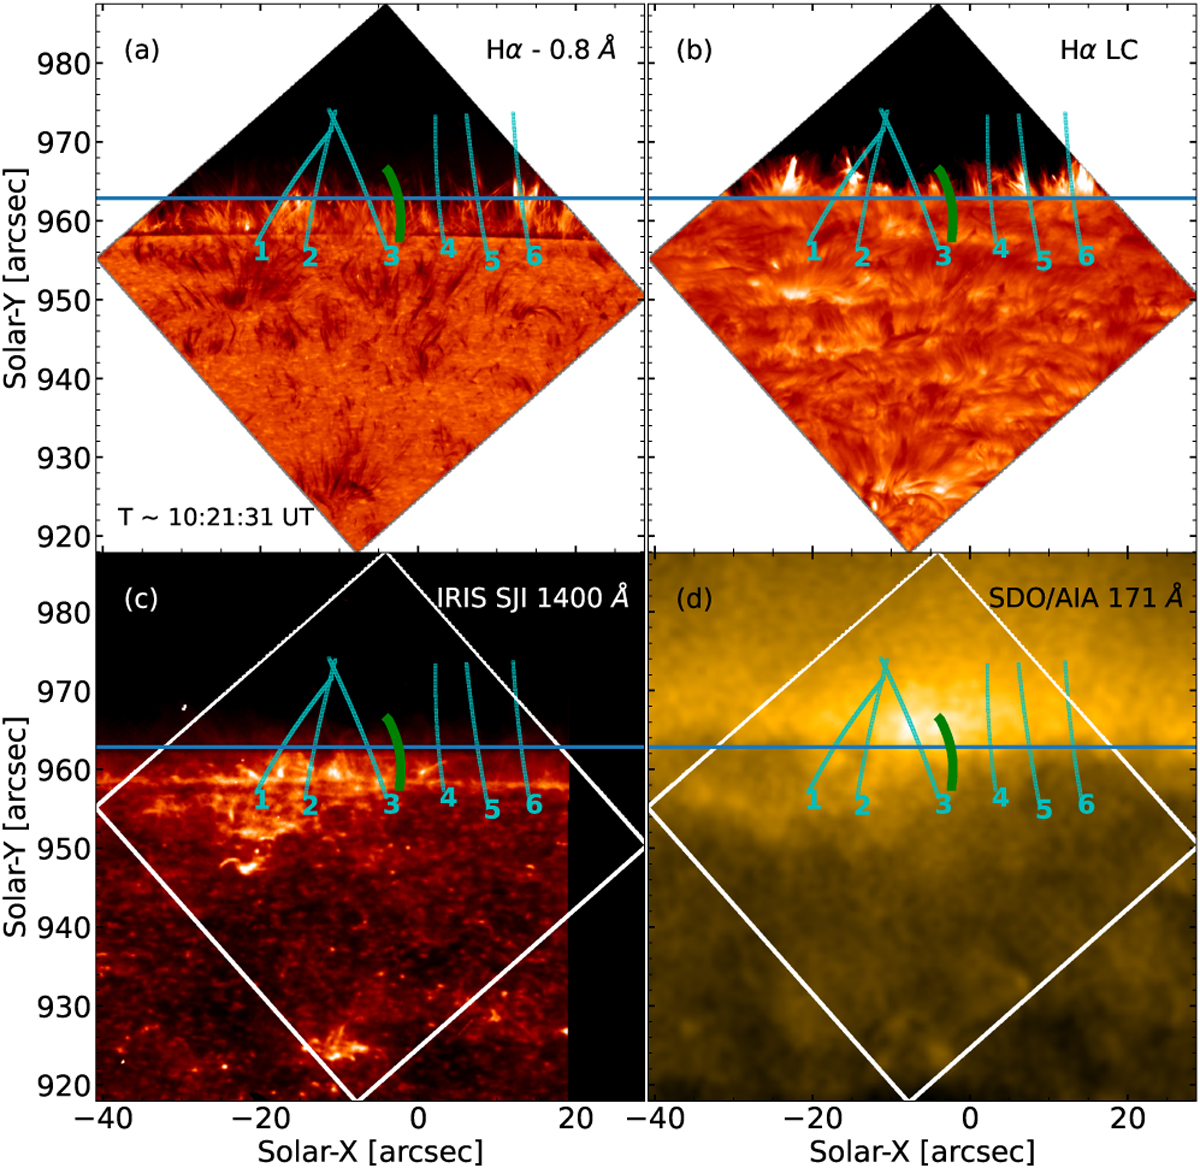
Overview of coordinated multiwavelength observations sampling the chromosphere, transition region, and corona. Panels a and b: SST Hα −0.8 Å wing and Hα line core images, respectively, representing the lower and middle chromosphere. Panel c: IRIS SJI 1400 Å image, sampling the transition region. Panel d: SDO/AIA 171 Å image, representing the million-degree corona. The horizontal blue line indicates the location of the IRIS spectrograph slit. The green line marks the positions of the virtual slit used to construct the space-time diagrams, as shown in Fig. 2. The six cyan lines mark the positions of the selected virtual slits, which are used to construct multi-thermal space-time diagrams for investigating the temporal and spatial evolution of structures across different atmospheric layers. The white diamond outlines the common field of view of the SST observations, overplotted on the IRIS and AIA panels for reference.
Current usage metrics show cumulative count of Article Views (full-text article views including HTML views, PDF and ePub downloads, according to the available data) and Abstracts Views on Vision4Press platform.
Data correspond to usage on the plateform after 2015. The current usage metrics is available 48-96 hours after online publication and is updated daily on week days.
Initial download of the metrics may take a while.