


Fig. 2
Download original image
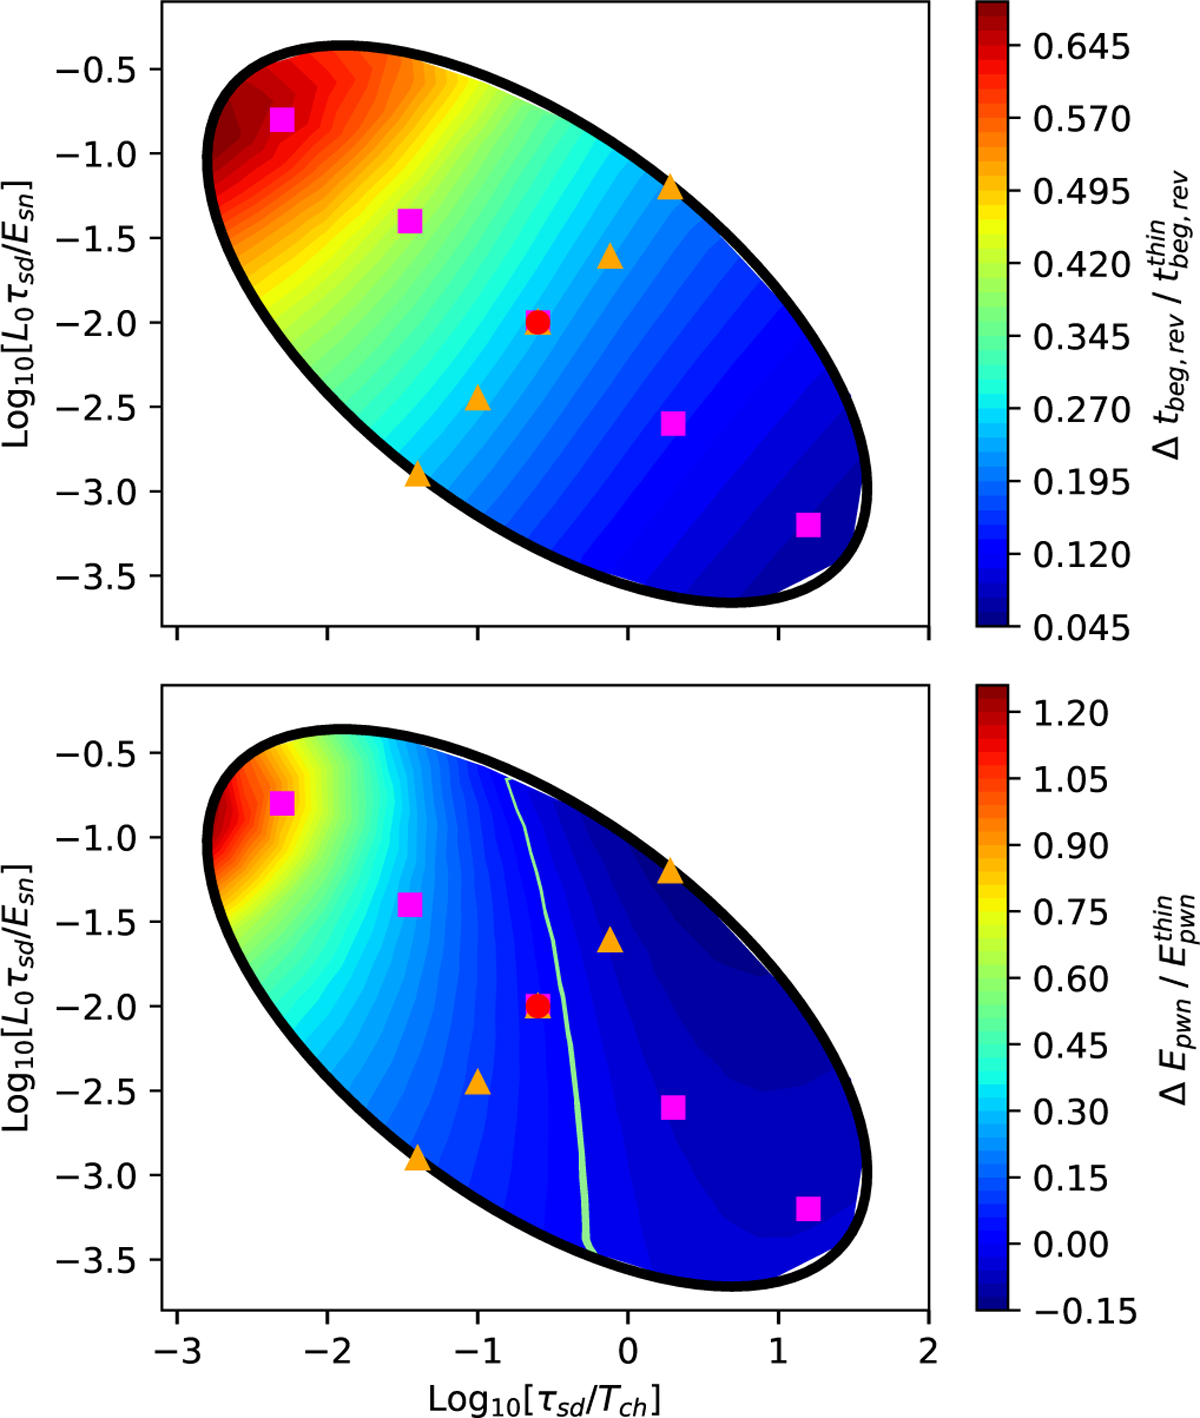
Comparison of canonical thin-shell and thick-shell models (X = 0.6) for the PWN-SNR population. The black ellipses represent the region in the characteristic plane containing 98% of the expected Galactic PWN-SNR population. The points represent the models of Table 1: the red dot at the center is C0, yellow triangles represent models of the sequence S#, and magenta squares show those of L#. The upper panel represents the relative difference in the time at which reverberation begins ![Mathematical equation: $\[\Delta t_{\text {beg,rev}}=t_{\text {beg,rev}}^{\text {thin}}-t_{\text {beg,rev}}^{\text {thick}}\]$](/articles/aa/full_html/2026/08/aa59784-26/aa59784-26-eq10.png) . The lower panel represents the relative difference in the energy content of the PWN at the time at which reverberation begins
. The lower panel represents the relative difference in the energy content of the PWN at the time at which reverberation begins ![Mathematical equation: $\[\Delta E_{\mathrm{pwn}}=E_{\mathrm{pwn}}^{\text {thick}}-E_{\mathrm{pwn}}^{\text {thin}}\]$](/articles/aa/full_html/2026/08/aa59784-26/aa59784-26-eq11.png) . The green line separates systems with a positive difference from systems with a negative difference.
. The green line separates systems with a positive difference from systems with a negative difference.
Current usage metrics show cumulative count of Article Views (full-text article views including HTML views, PDF and ePub downloads, according to the available data) and Abstracts Views on Vision4Press platform.
Data correspond to usage on the plateform after 2015. The current usage metrics is available 48-96 hours after online publication and is updated daily on week days.
Initial download of the metrics may take a while.