


Fig. 5
Download original image
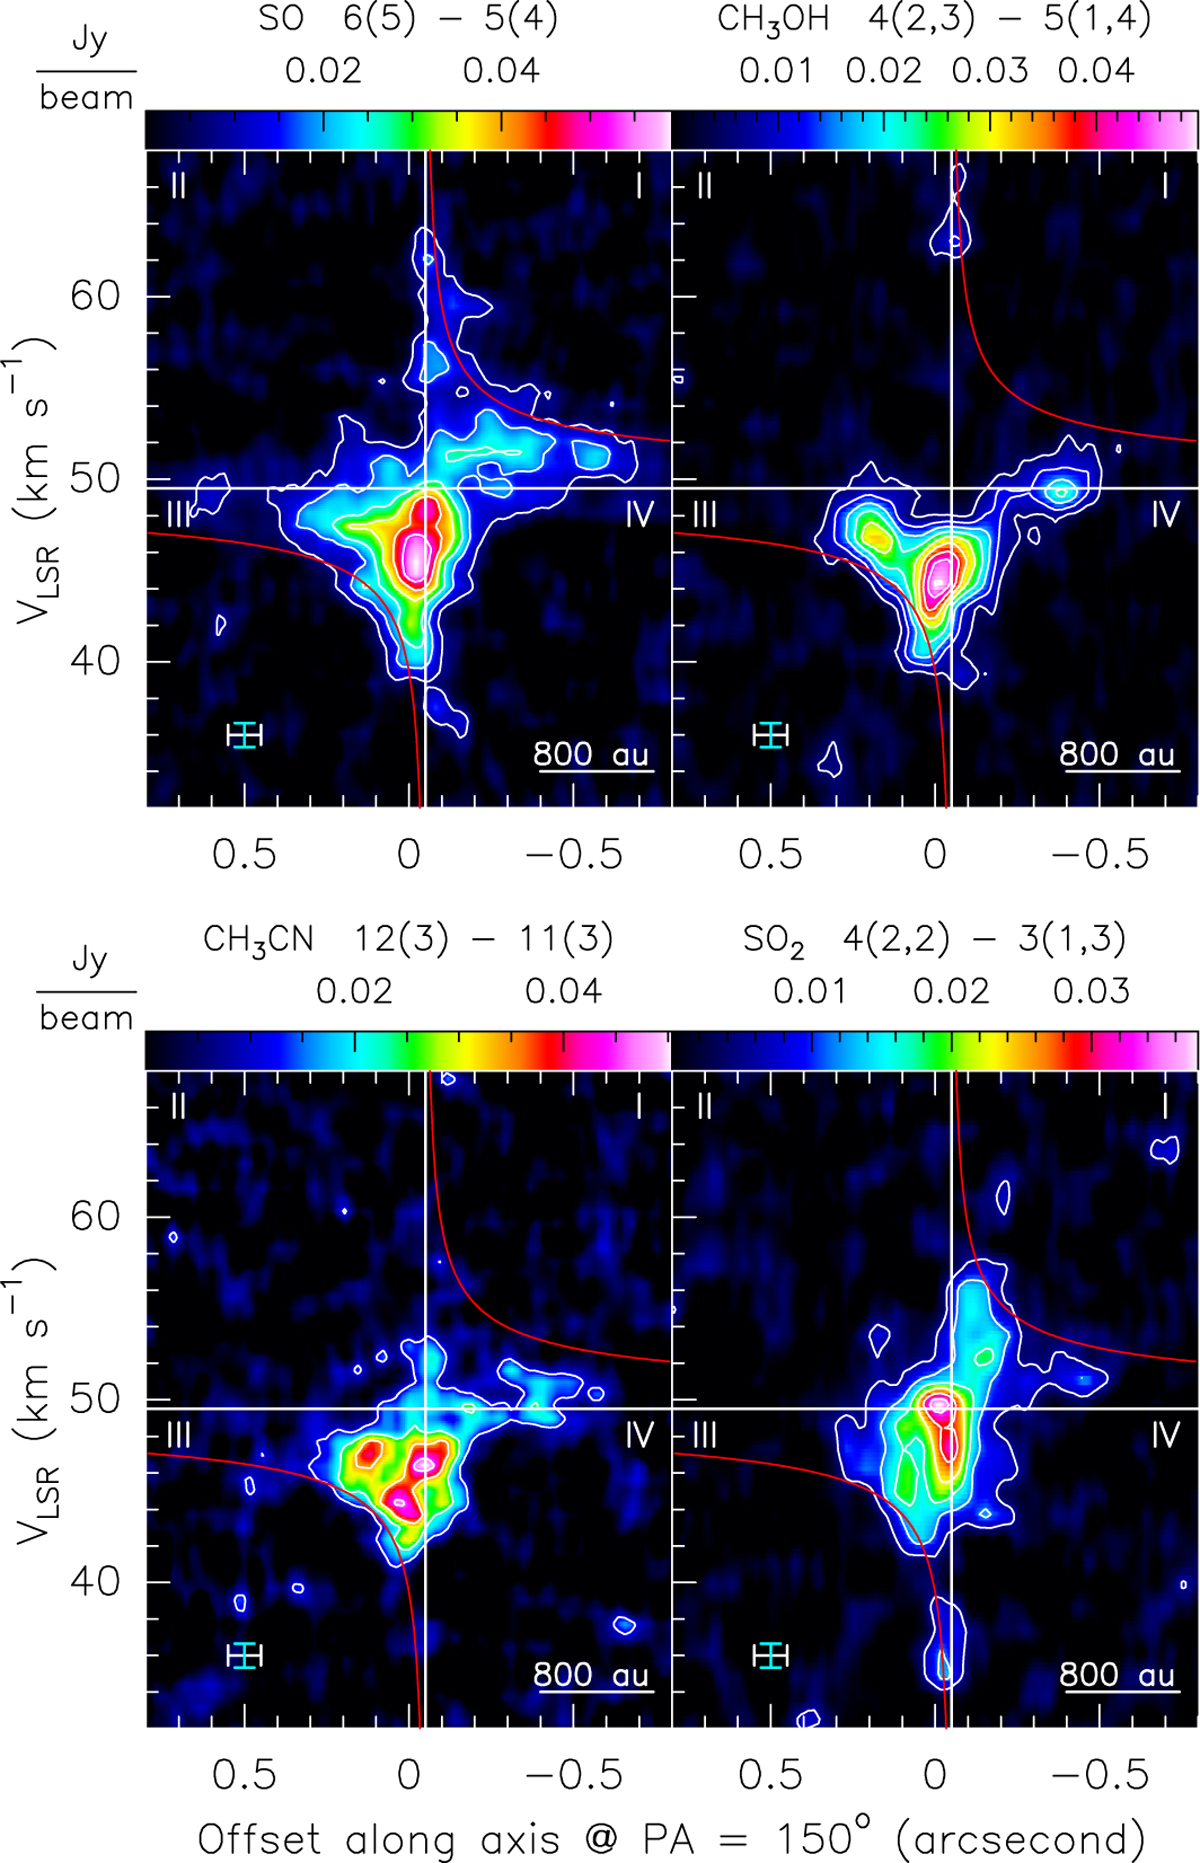
Gas kinematics in G035.02+0.35. Each of the four panels presents the PV plot along the cut at PA = 150° (marked by the dashed black line in Figs. 1b and 3) of the molecular line specified above the panel. PV plots are shown with color maps and white contours, with contour levels ranging from |Imin|/2 to Imax at steps of |Imin|/2, where Imin and Imax are the minimum and maximum of the map, respectively. In each panel, the vertical and horizontal white axes denote the positional offset (![Mathematical equation: $\[\mathrm{\approx}\mathrm{-}0^{\prime\prime}_\cdot05\]$](/articles/aa/full_html/2026/07/aa60059-26/aa60059-26-eq20.png) ) of the YSO relative to the phase center of the observations and YSO VLSR (≈49.5 km s−1), respectively. The four quadrants are labeled with roman numbers. For comparison, the red curve shows the Keplerian velocity profile for a central mass of 20 M⊙. In the lower left corner of the panels, the vertical cyan and horizontal white error bars indicate the velocity and spatial resolutions, respectively.
) of the YSO relative to the phase center of the observations and YSO VLSR (≈49.5 km s−1), respectively. The four quadrants are labeled with roman numbers. For comparison, the red curve shows the Keplerian velocity profile for a central mass of 20 M⊙. In the lower left corner of the panels, the vertical cyan and horizontal white error bars indicate the velocity and spatial resolutions, respectively.
Current usage metrics show cumulative count of Article Views (full-text article views including HTML views, PDF and ePub downloads, according to the available data) and Abstracts Views on Vision4Press platform.
Data correspond to usage on the plateform after 2015. The current usage metrics is available 48-96 hours after online publication and is updated daily on week days.
Initial download of the metrics may take a while.