


Fig. 2
Download original image
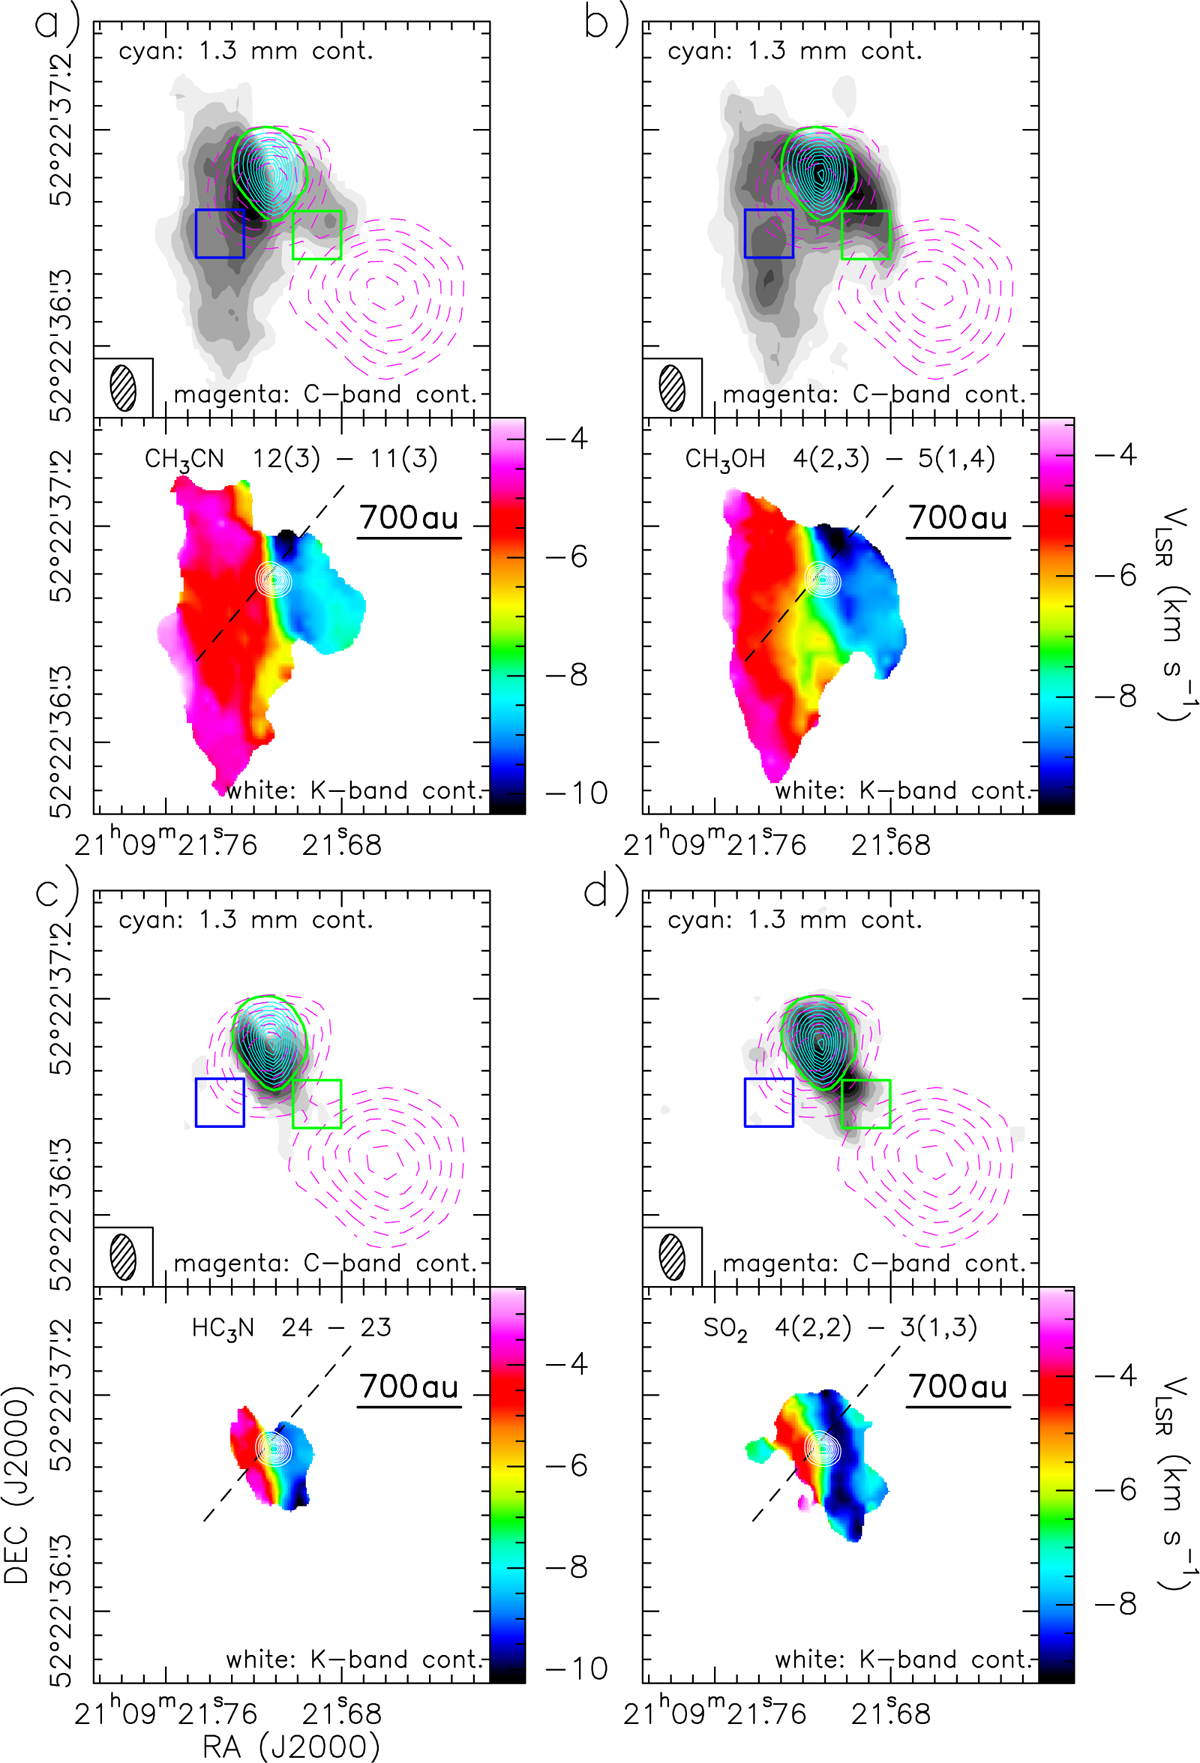
Structure and kinematics of the IRAS 21078+5211 wind in molecular tracers. Each of the four panels presents the maps of the velocity-integrated emission (upper plot) and intensity-weighted velocity (lower plot) for a specific molecular line, as labeled. The level contours of the grayscale filled-contours maps in the upper plots are from 10 to 80% in steps of 10% of the map peak. Contours, lines, and symbols have the same meanings as in Fig. 1a.
Current usage metrics show cumulative count of Article Views (full-text article views including HTML views, PDF and ePub downloads, according to the available data) and Abstracts Views on Vision4Press platform.
Data correspond to usage on the plateform after 2015. The current usage metrics is available 48-96 hours after online publication and is updated daily on week days.
Initial download of the metrics may take a while.