


Fig. 1
Download original image
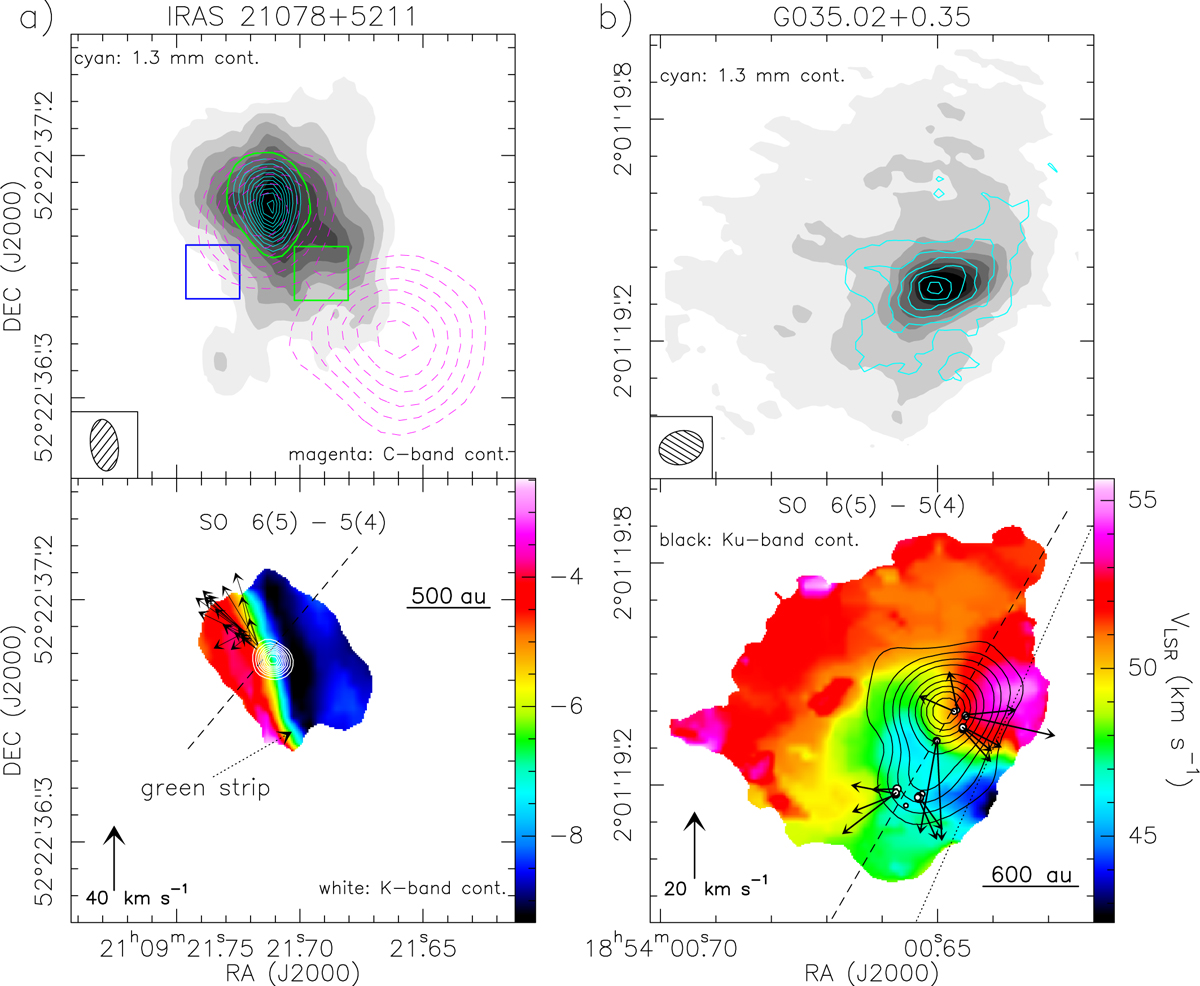
Rotating wind in IRAS 21078+5211 (panel a) and G035.02 +0.35 (panel b). In both panels, the grayscale and color maps in the upper and lower plots correspond to the velocity-integrated emission and intensity-weighted velocity, respectively, of the SO 65–54 line. The green color represents VLSR close to the systemic velocity. (Panel a) The level contours of the grayscale filled-contours map in the upper plot are from 10 to 80% in steps of 10% of the map peak of 0.25 Jy beam−1 km s−1. Cyan contours reproduce the 1.3 mm continuum showing levels from 1.9 to 11.9 mJy beam−1 at steps of 1.0 mJy beam−1. The JVLA C- and K-band continuum emissions are given by magenta and white contours, respectively, and black arrows show the proper motions of the 22 GHz water masers (Moscadelli et al. 2016, see their Fig. 8). The dashed black line marks the direction of the disk midplane at PA≈140° (see Sect. 3.1). The thick green contour and thick green and blue squares in the upper plot delimitate the integration area for the spectra toward the YSO and outflow (see Sect. 3.2). In the lower plot, the green strip (see Sects. 3.1 and 4.1.1) is indicated. (Panel b) The level contours of the grayscale filled-contours map in the upper plot are 5%, 15%, and from 30 to 80% in steps of 10% of the map peak of 0.70 Jy beam−1 km s−1. Cyan contours reproduce the 1.3 mm continuum showing levels from 1.2 to 6.2 mJy beam−1 at steps of 1.0 mJy beam−1. The JVLA Ku-band continuum emission is shown with black contours, and black-edge white dots and black arrows give the positions and proper motions of the 22 GHz water masers (Moscadelli et al. 2019b, see their Fig. 2). The dashed black line marks the direction of the disk midplane at PA≈150° (see Sect. 3.1). The dotted black line crossing the loci of maximum and minimum VLSR indicates the approximate direction of the SO VLSR gradient.
Current usage metrics show cumulative count of Article Views (full-text article views including HTML views, PDF and ePub downloads, according to the available data) and Abstracts Views on Vision4Press platform.
Data correspond to usage on the plateform after 2015. The current usage metrics is available 48-96 hours after online publication and is updated daily on week days.
Initial download of the metrics may take a while.