


Fig. 6
Download original image
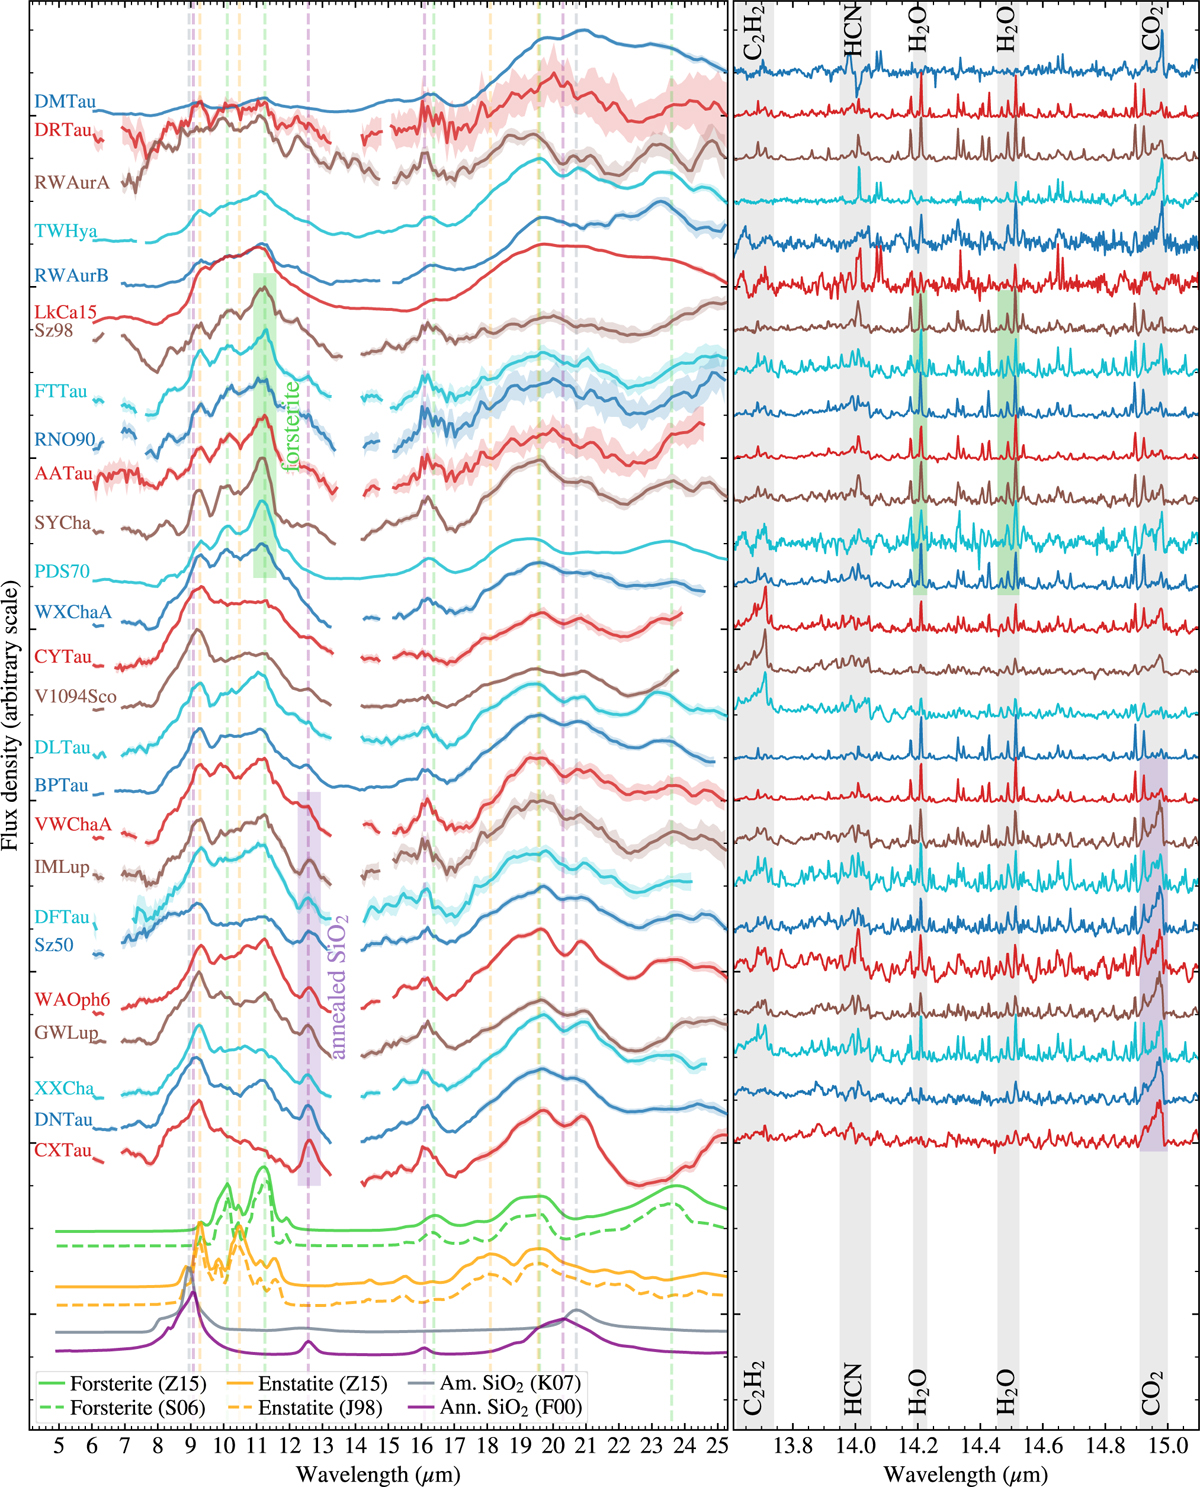
Left: residual dust spectra after subtracting the modeled contributions of the amorphous Mg-silicates and featureless components. Each residual spectrum has been normalized to its maximum value. The residuals show features of crystalline Mg-silicates and of SiO2 (both amorphous and annealed). For comparison, at the bottom of the plot, we have plotted the opacity curves of 0.1 μm-sized forsterite, enstatite, amorphous silica, and annealed silica. The positions of major feature peaks are indicated by vertical dashed lines. The green and purple rectangles highlight spectra with prominent features from forsterite and from annealed silica, respectively. Right: continuum-subtracted spectra at full spectral resolution, showing molecular emission lines. The spectra have been normalized to their maximum value within the plotted wavelength range. Most objects showing strong annealed silica features in their dust spectra have relatively strong CO2 lines, while those with prominent forsterite features tend to be water-rich.
Current usage metrics show cumulative count of Article Views (full-text article views including HTML views, PDF and ePub downloads, according to the available data) and Abstracts Views on Vision4Press platform.
Data correspond to usage on the plateform after 2015. The current usage metrics is available 48-96 hours after online publication and is updated daily on week days.
Initial download of the metrics may take a while.