


Fig. 9.
Download original image
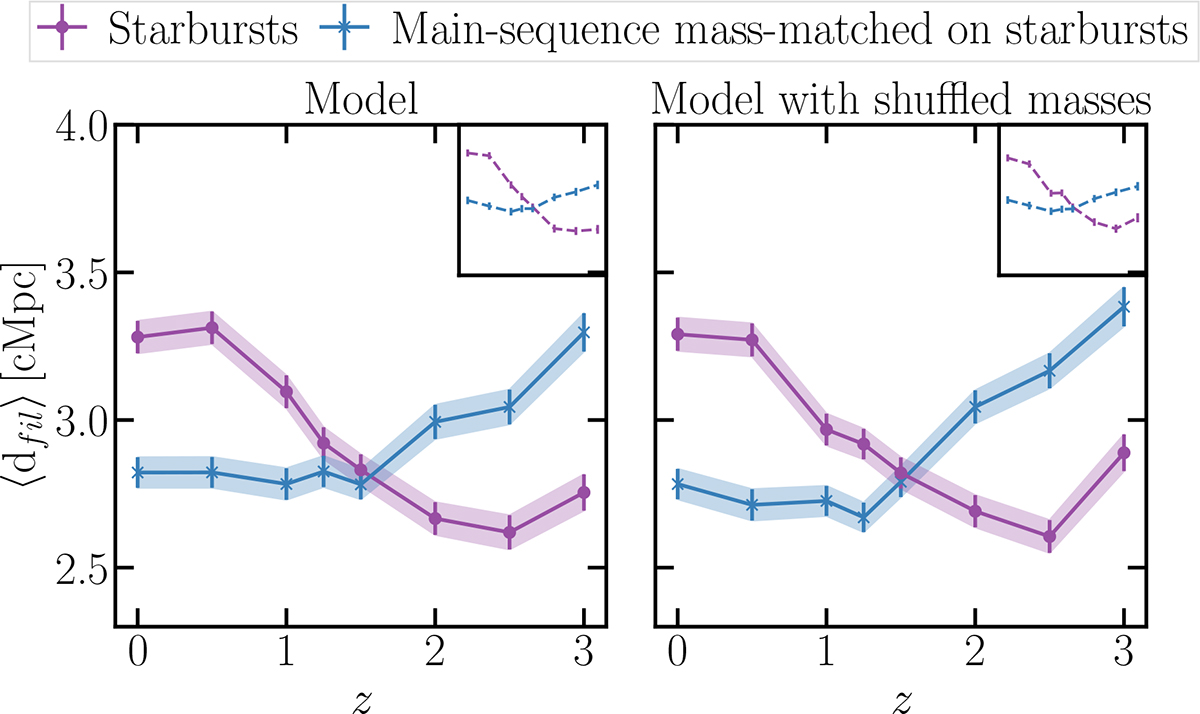
Left panel: Same quantities as in Fig. 8 after correction of the SFR modulation with distance and randomly picking a SFR deviation from a Schreiber et al. (2015) MS modified to fit SIMBA’s MS. Here, starbursts have SFRs such as log(SFR/SFRMS) > 0.4 dex. Right panel: Same quantities as in the left panel with shuffled galaxy masses. Although the ⟨dfil⟩ values change, the lines cross as in Fig. 8, and the general trends are similar. This allowed us to test the effect of modulation of SFR with the distance to filaments characterised in J26.
Current usage metrics show cumulative count of Article Views (full-text article views including HTML views, PDF and ePub downloads, according to the available data) and Abstracts Views on Vision4Press platform.
Data correspond to usage on the plateform after 2015. The current usage metrics is available 48-96 hours after online publication and is updated daily on week days.
Initial download of the metrics may take a while.