


Fig. 6.
Download original image
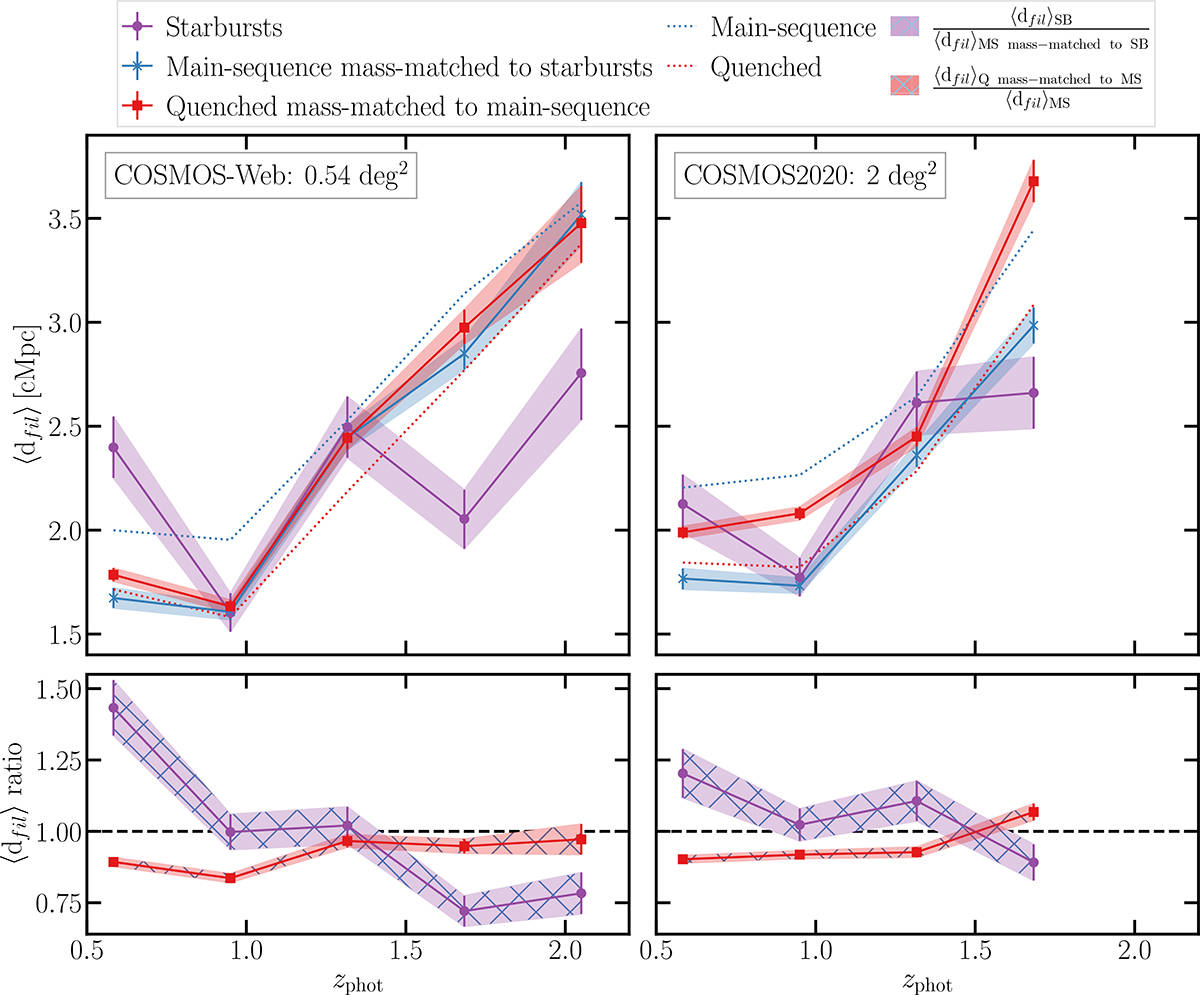
Upper row: Mean distance to the 2D cosmic web for starburst galaxies (purple solid line), MS galaxies mass-matched to starbursts (blue solid line), and quenched galaxies mass-matched to MS galaxies (red solid line) as a function of redshift in COSMOS-Web (left) and COSMOS2020 (right). The mean distances for the full MS and quenched samples are shown as blue and red dotted lines, respectively. Lower row: Ratio of the mean distance of starbursts to that of mass-matched MS galaxies as a function of redshift (purple curve with blue hatching, derived from the purple and blue solid lines in the upper row). The red curve with blue hatching shows the ratio of the mean distance of quenched galaxies mass-matched to MS galaxies to that of the full MS sample (derived from the red solid line and blue dotted line in the upper row). The cosmic web was reconstructed independently for each dataset using the corresponding galaxy distribution. Distances to filaments were then measured with respect to the skeleton derived from the same catalogue.
Current usage metrics show cumulative count of Article Views (full-text article views including HTML views, PDF and ePub downloads, according to the available data) and Abstracts Views on Vision4Press platform.
Data correspond to usage on the plateform after 2015. The current usage metrics is available 48-96 hours after online publication and is updated daily on week days.
Initial download of the metrics may take a while.