


Fig. 3.
Download original image
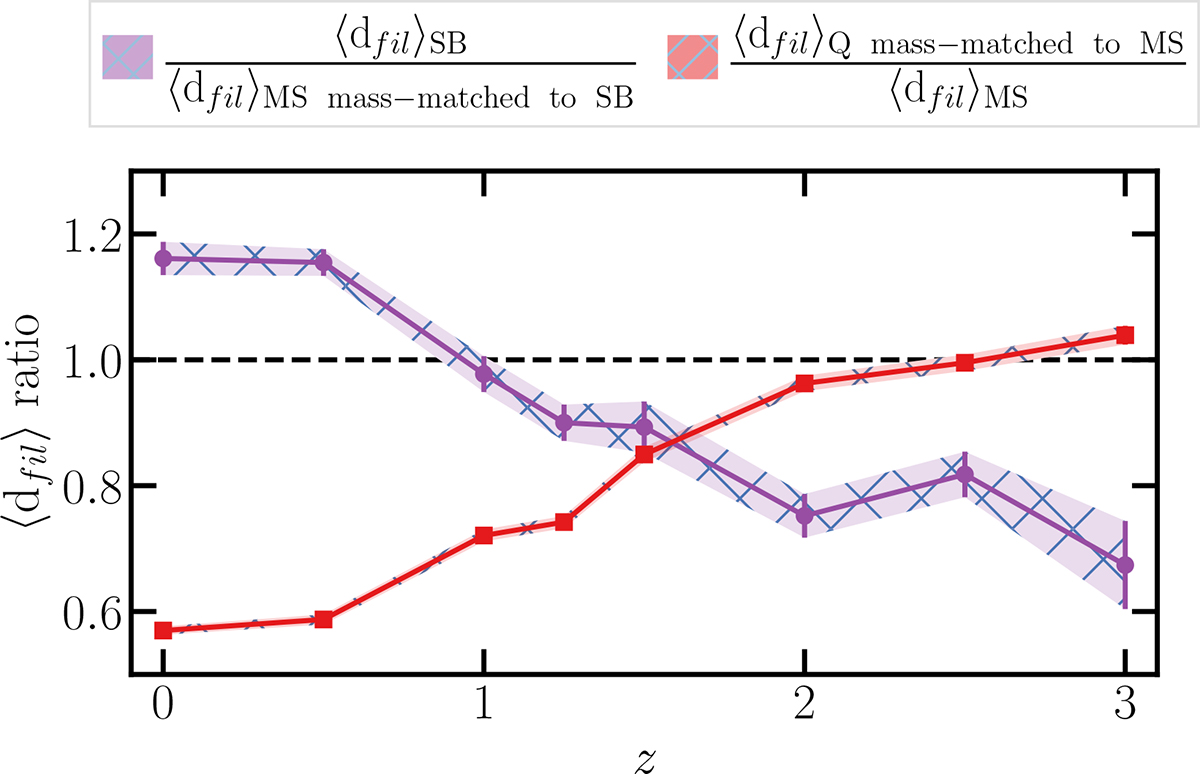
Ratio of the mean projected (2D) distance to cosmic filaments for two galaxy populations as a function of redshift in SIMBA with log(SFRSB/SFRMS) > 0.2 dex and log(τSB/τMS) < − 0.2 dex. The purple curve shows the ratio between starbursts and MS galaxies mass-matched to starbursts (solid purple line and solid blue line in Fig. 2). The red curve shows the ratio between quenched galaxies mass-matched to the MS sample and MS galaxies (solid red line and dotted blue line in Fig. 2). At late cosmic times, starbursts are, on average, located farther from filaments than their mass-matched MS counterparts. On the other hand, quenched galaxies lie, on average, closer to filaments than mass-matched MS galaxies, and the contrast between the two increases towards lower redshift values.
Current usage metrics show cumulative count of Article Views (full-text article views including HTML views, PDF and ePub downloads, according to the available data) and Abstracts Views on Vision4Press platform.
Data correspond to usage on the plateform after 2015. The current usage metrics is available 48-96 hours after online publication and is updated daily on week days.
Initial download of the metrics may take a while.