


Fig. 2.
Download original image
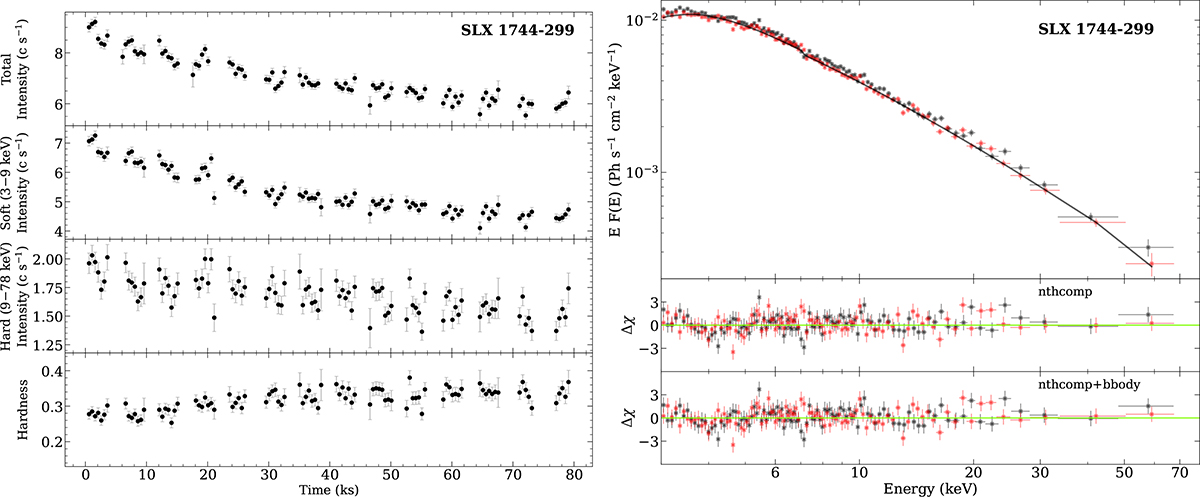
Left panel: Background-corrected NuSTAR light curve of SLX 1744−299 with a time bin of 500 sec. From top to bottom: the total light curve in the 3–78 keV energy range, the soft band (3–9 keV), the hard band (9–78 keV), and the hardness ratio (hard-to-soft) as a function of time. Right panel: Unfolded NuSTAR FPMA (red) and FPMB (black) spectrum (top) and residuals (middle and bottom) using the const×TBabs×(nthComp) model. The bottom panel shows the fit residuals when using const×TBabs×(bbodyrad+nthComp).
Current usage metrics show cumulative count of Article Views (full-text article views including HTML views, PDF and ePub downloads, according to the available data) and Abstracts Views on Vision4Press platform.
Data correspond to usage on the plateform after 2015. The current usage metrics is available 48-96 hours after online publication and is updated daily on week days.
Initial download of the metrics may take a while.