


Fig. 6
Download original image
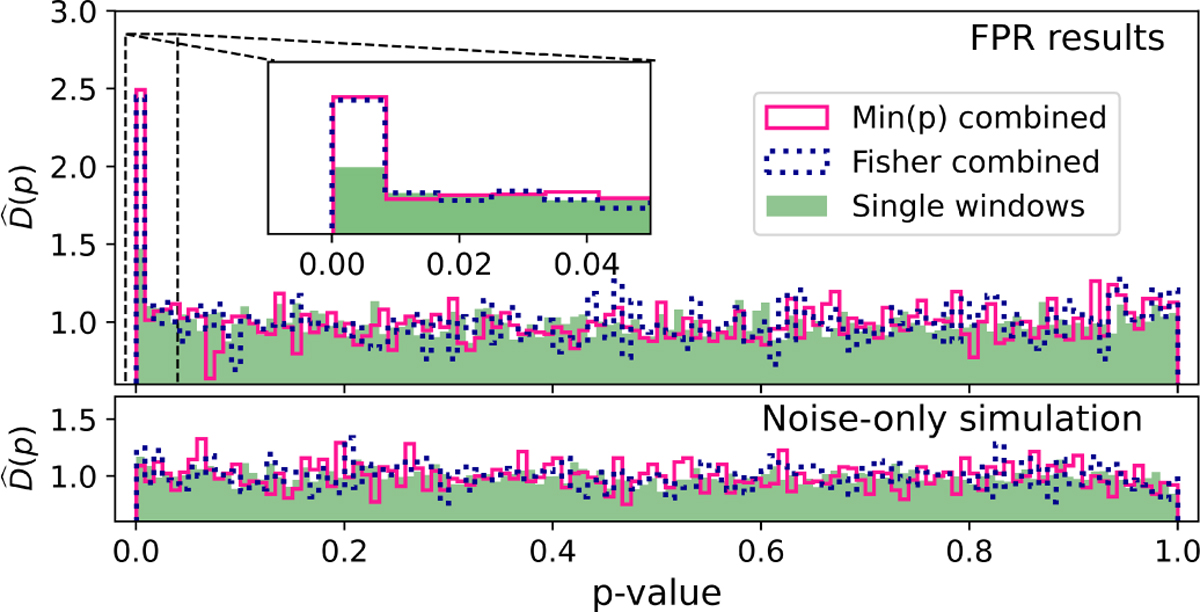
Estimated density distribution ![Mathematical equation: $\[\widehat{D}(p)\]$](/articles/aa/full_html/2026/07/aa59515-26/aa59515-26-eq43.png) of p-values for single-window objects (green), and for multiple-window objects with p-values combined using the Fisher method (magenta) and combined with the min(p) method (blue). Top panel: p-value distributions from the FPR data. The inset shows a zoom of the area delimited by the dashed line. Bottom panel: Results from one noise-only simulation run.
of p-values for single-window objects (green), and for multiple-window objects with p-values combined using the Fisher method (magenta) and combined with the min(p) method (blue). Top panel: p-value distributions from the FPR data. The inset shows a zoom of the area delimited by the dashed line. Bottom panel: Results from one noise-only simulation run.
Current usage metrics show cumulative count of Article Views (full-text article views including HTML views, PDF and ePub downloads, according to the available data) and Abstracts Views on Vision4Press platform.
Data correspond to usage on the plateform after 2015. The current usage metrics is available 48-96 hours after online publication and is updated daily on week days.
Initial download of the metrics may take a while.