


Fig. D.1
Download original image
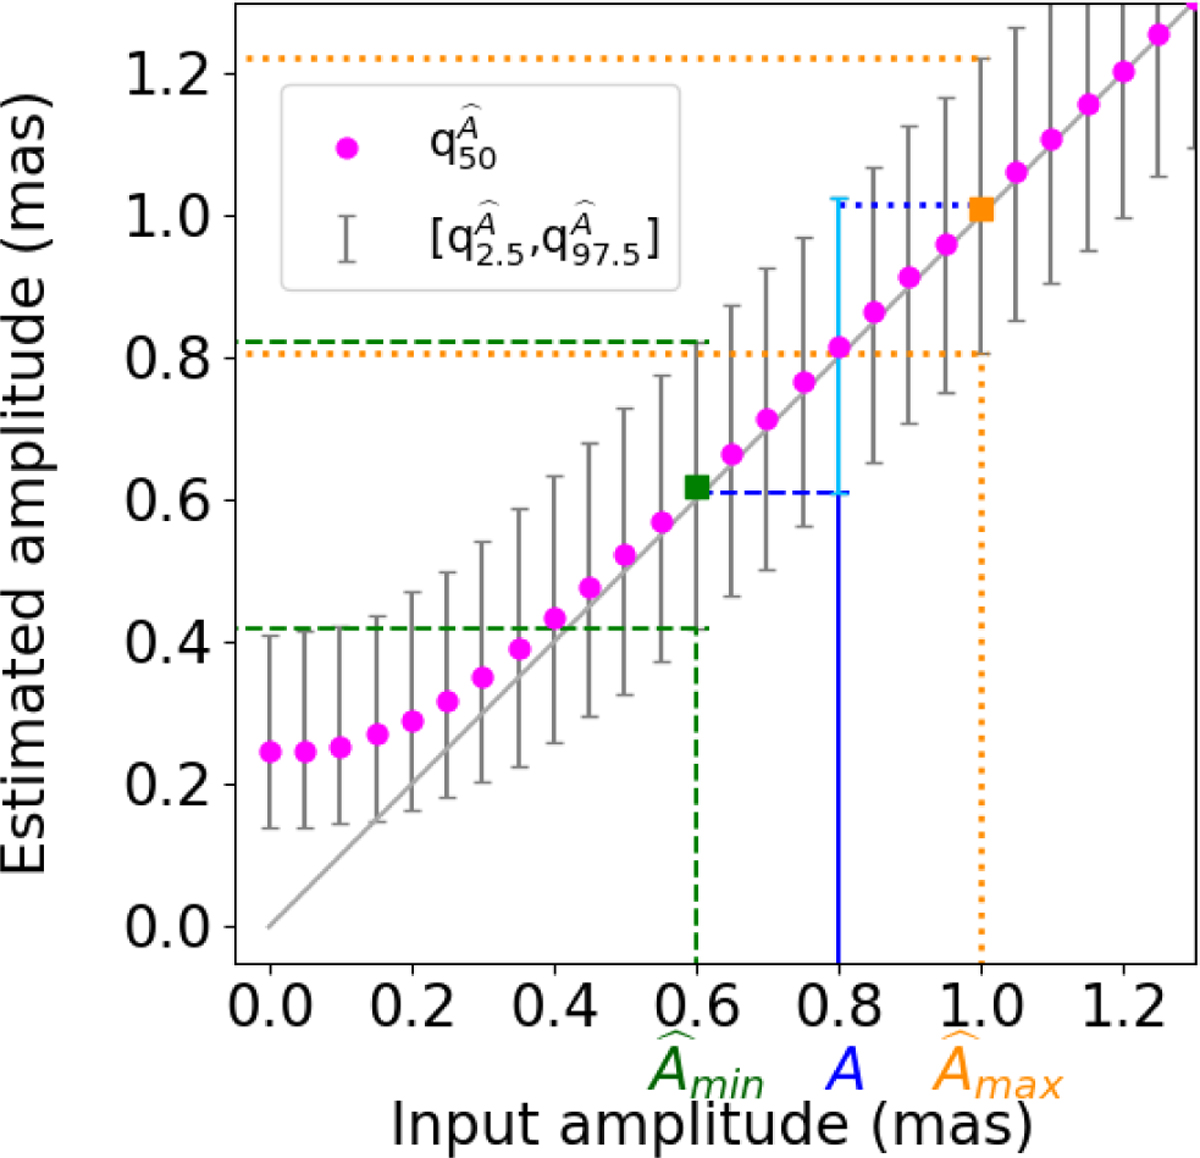
Wobble amplitude confidence interval estimation for a range of small amplitudes. The pink dots represent the quantiles ![Mathematical equation: $\[q_{50}^{\widehat{A}}\]$](/articles/aa/full_html/2026/07/aa59515-26/aa59515-26-eq108.png) estimated from the respective input amplitudes, while the error bars indicate the estimated confidence intervals
estimated from the respective input amplitudes, while the error bars indicate the estimated confidence intervals ![Mathematical equation: $\[\mathcal{I}_{A}=[q_{2.5}^{\widehat{A}}, q_{97.5}^{\widehat{A}}]\]$](/articles/aa/full_html/2026/07/aa59515-26/aa59515-26-eq109.png) . The coloured dotted and dashed lines show one example of a signal with true amplitude A = 0.8 mas, where ℐA= [0.61,1.02] mas, and where these limits are considered to be input values (
. The coloured dotted and dashed lines show one example of a signal with true amplitude A = 0.8 mas, where ℐA= [0.61,1.02] mas, and where these limits are considered to be input values (![Mathematical equation: $\[\widehat{A}_{\text {min}}\]$](/articles/aa/full_html/2026/07/aa59515-26/aa59515-26-eq110.png) and
and ![Mathematical equation: $\[\widehat{A}_{\text {max}}\]$](/articles/aa/full_html/2026/07/aa59515-26/aa59515-26-eq111.png) ) from a signal with unknown amplitude (see text).
) from a signal with unknown amplitude (see text).
Current usage metrics show cumulative count of Article Views (full-text article views including HTML views, PDF and ePub downloads, according to the available data) and Abstracts Views on Vision4Press platform.
Data correspond to usage on the plateform after 2015. The current usage metrics is available 48-96 hours after online publication and is updated daily on week days.
Initial download of the metrics may take a while.