


Fig. 1
Download original image
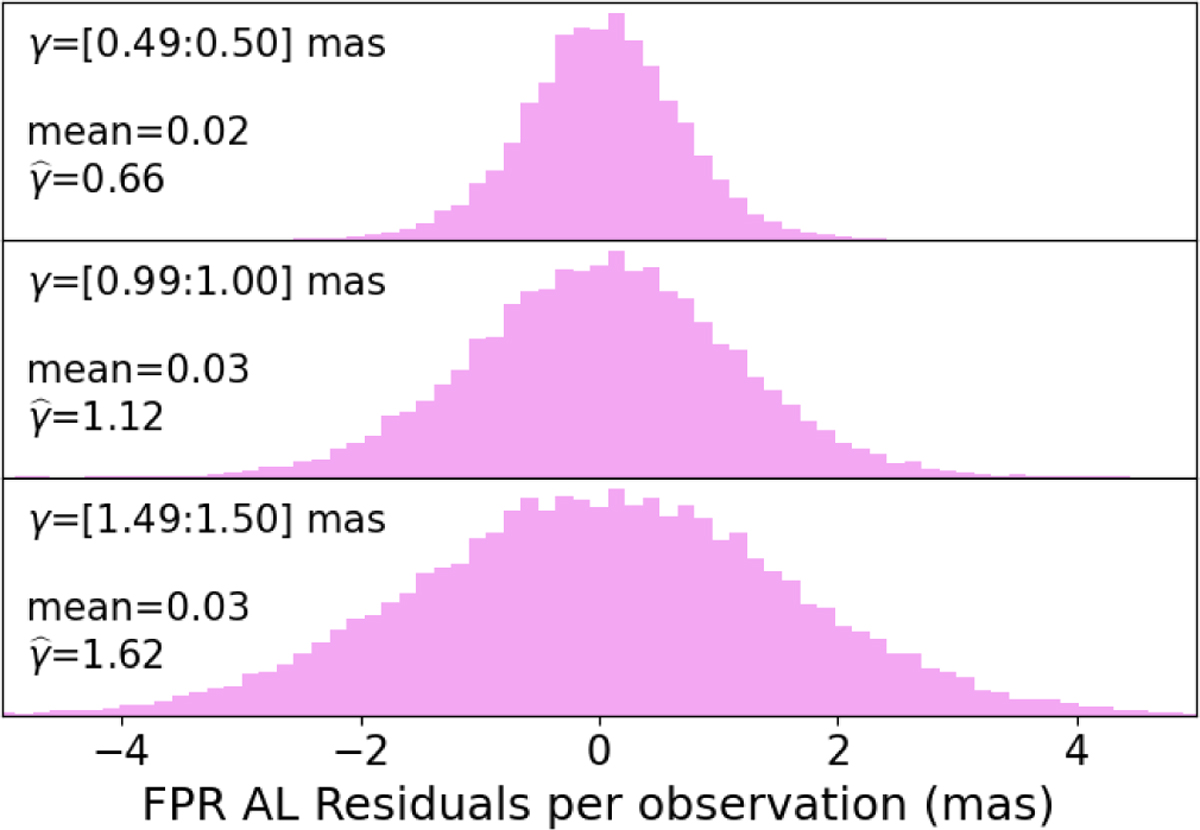
Distribution of AL-projected residuals from Gaia FPR per observation (i.e. not averaged by transit). For each panel, we select an interval of per-observation random errors projected in AL (γ) from Gaia FPR. For all observations in the Gaia FPR catalogue with γ within this interval, we retrieve the corresponding residuals; their distribution is shown in pink, with the empirical mean and std ![Mathematical equation: $\[\widehat{\gamma}\]$](/articles/aa/full_html/2026/07/aa59515-26/aa59515-26-eq6.png) indicated. The distributions in the top, middle, and bottom plots contain 22k, 45k and 56k observations, respectively.
indicated. The distributions in the top, middle, and bottom plots contain 22k, 45k and 56k observations, respectively.
Current usage metrics show cumulative count of Article Views (full-text article views including HTML views, PDF and ePub downloads, according to the available data) and Abstracts Views on Vision4Press platform.
Data correspond to usage on the plateform after 2015. The current usage metrics is available 48-96 hours after online publication and is updated daily on week days.
Initial download of the metrics may take a while.