


Fig. 4.
Download original image
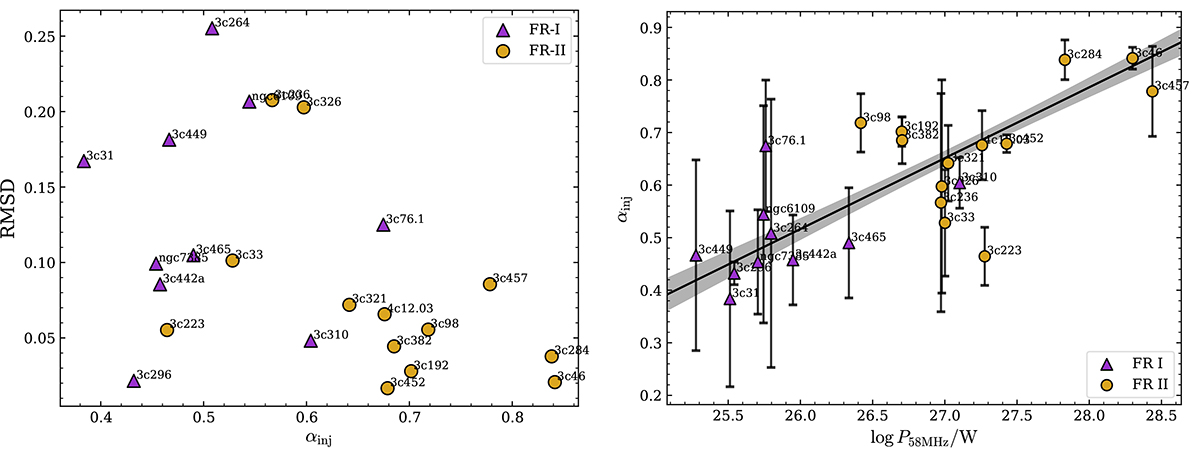
Left panel: Measured injection index plotted against their uncertainty from RMSD where we differentiated between FR I and FR II type galaxies. Right panel: shows the apparent relation between the measured injection index and the total radio power. Purple triangles depict the FR Is in our sample and the orange circles depict the FR IIs. The black line and shaded area are a linear MCMC fit and the uncertainty respectively.
Current usage metrics show cumulative count of Article Views (full-text article views including HTML views, PDF and ePub downloads, according to the available data) and Abstracts Views on Vision4Press platform.
Data correspond to usage on the plateform after 2015. The current usage metrics is available 48-96 hours after online publication and is updated daily on week days.
Initial download of the metrics may take a while.