


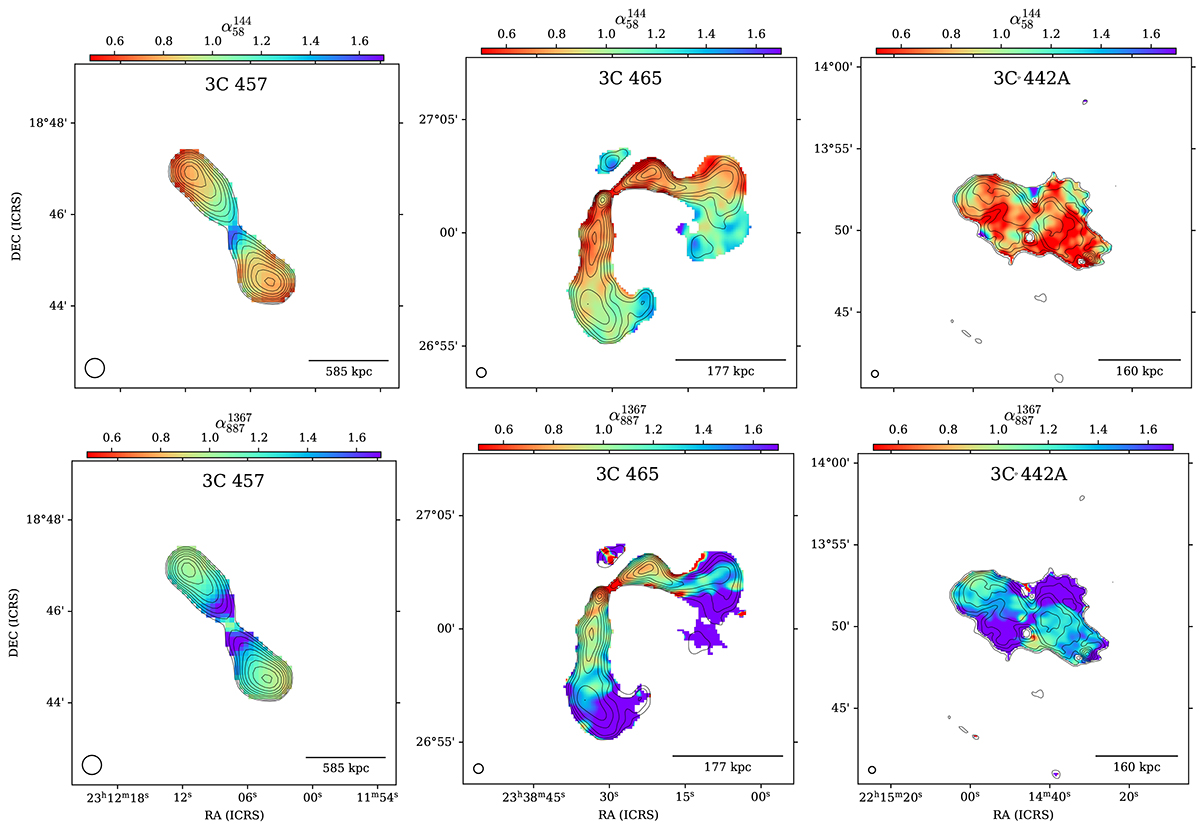
Fig. 2.
Download original image
Spectral index maps for 3C 457, 3C 465, and 3C 442A at 25″ × 25″. The colour scale is set between 0.5 and 1.7 for every image. The contours are drawn at [3, 5, 10, 50, 100, 200]×σrms of the LBA image. Every map shows spectral index values with a threshold of 2σrms. Finally, the beam for that map and the physical scale of the source are also indicated.
Current usage metrics show cumulative count of Article Views (full-text article views including HTML views, PDF and ePub downloads, according to the available data) and Abstracts Views on Vision4Press platform.
Data correspond to usage on the plateform after 2015. The current usage metrics is available 48-96 hours after online publication and is updated daily on week days.
Initial download of the metrics may take a while.