


Fig. B.1.
Download original image
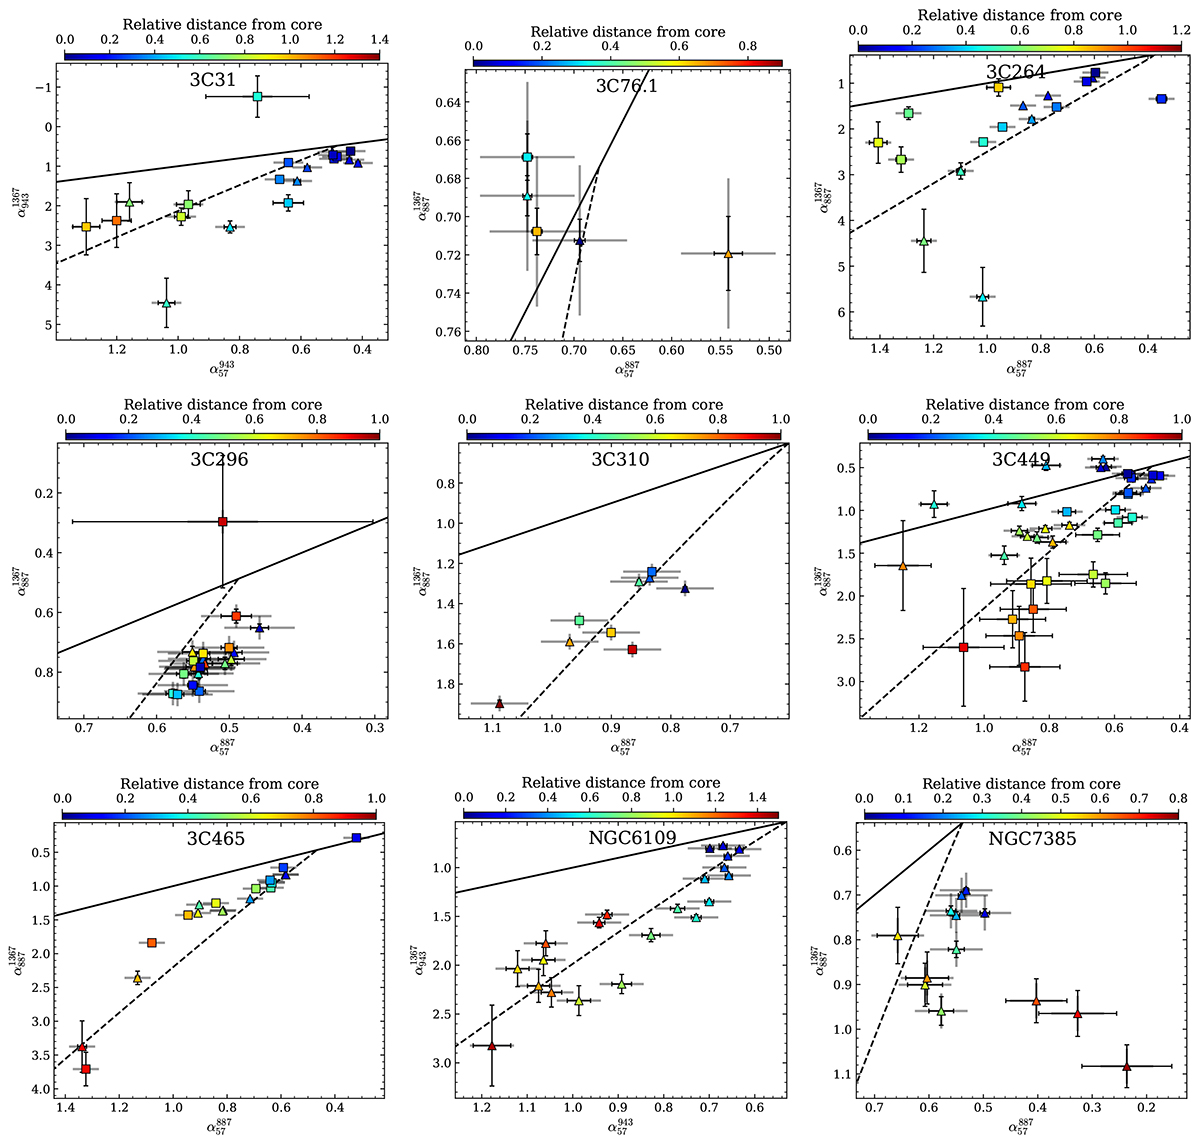
Colour-colour diagrams of FR I galaxies in Table 2 in the  (or
(or  ) plane. The colour scale denotes the distance from the core relative to the approximate size in Table 2. The solid grey error bar denotes the possible systematic shift of data points due to calibration errors and the thin black error bars denote the rms flux uncertainty. The solid line denotes a pure power-law and the dashed line a JP model. The two lobes are differentiated by either showing a square or triangle. Regions containing the core are excluded from the figure.
Current usage metrics show cumulative count of Article Views (full-text article views including HTML views, PDF and ePub downloads, according to the available data) and Abstracts Views on Vision4Press platform.
Data correspond to usage on the plateform after 2015. The current usage metrics is available 48-96 hours after online publication and is updated daily on week days.
Initial download of the metrics may take a while.