


Fig. 9.
Download original image
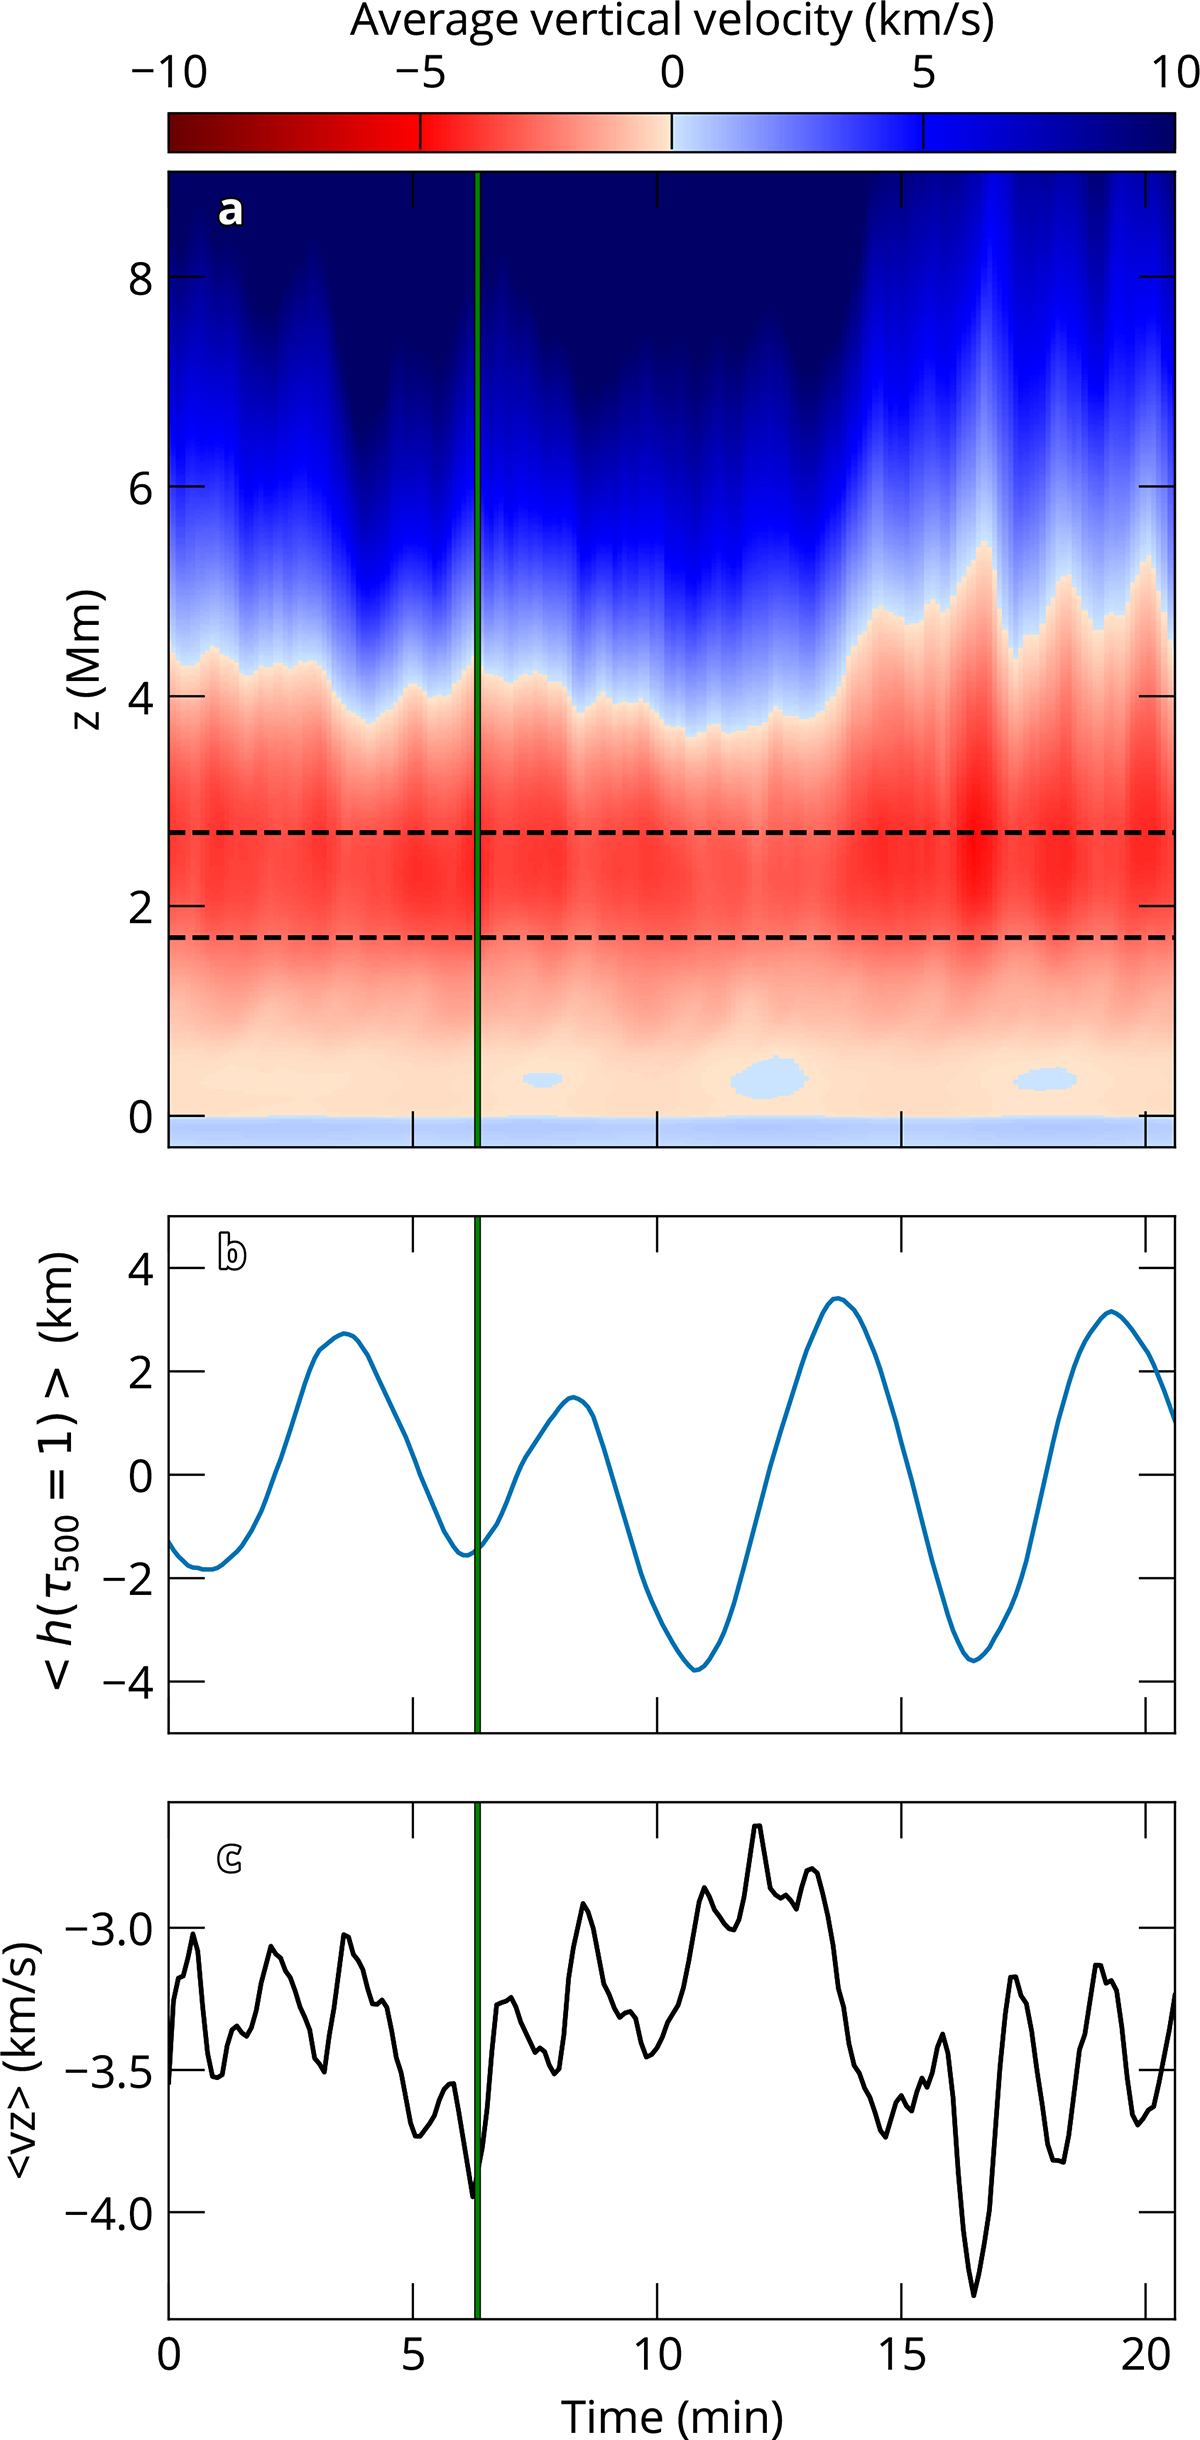
Time-dependent velocity structure in the atmosphere. Panel (a) shows the average velocity as a function of height. Panel (b) shows the time-dependent average height of the τ500 = 1 surface. Panel (c) shows the average vertical velocity between z = 1.7 Mm and z = 2.7 Mm, which are the average formation heights of the k2v feature and k3 feature in the snapshot presented here.
Current usage metrics show cumulative count of Article Views (full-text article views including HTML views, PDF and ePub downloads, according to the available data) and Abstracts Views on Vision4Press platform.
Data correspond to usage on the plateform after 2015. The current usage metrics is available 48-96 hours after online publication and is updated daily on week days.
Initial download of the metrics may take a while.