


Fig. 4.
Download original image
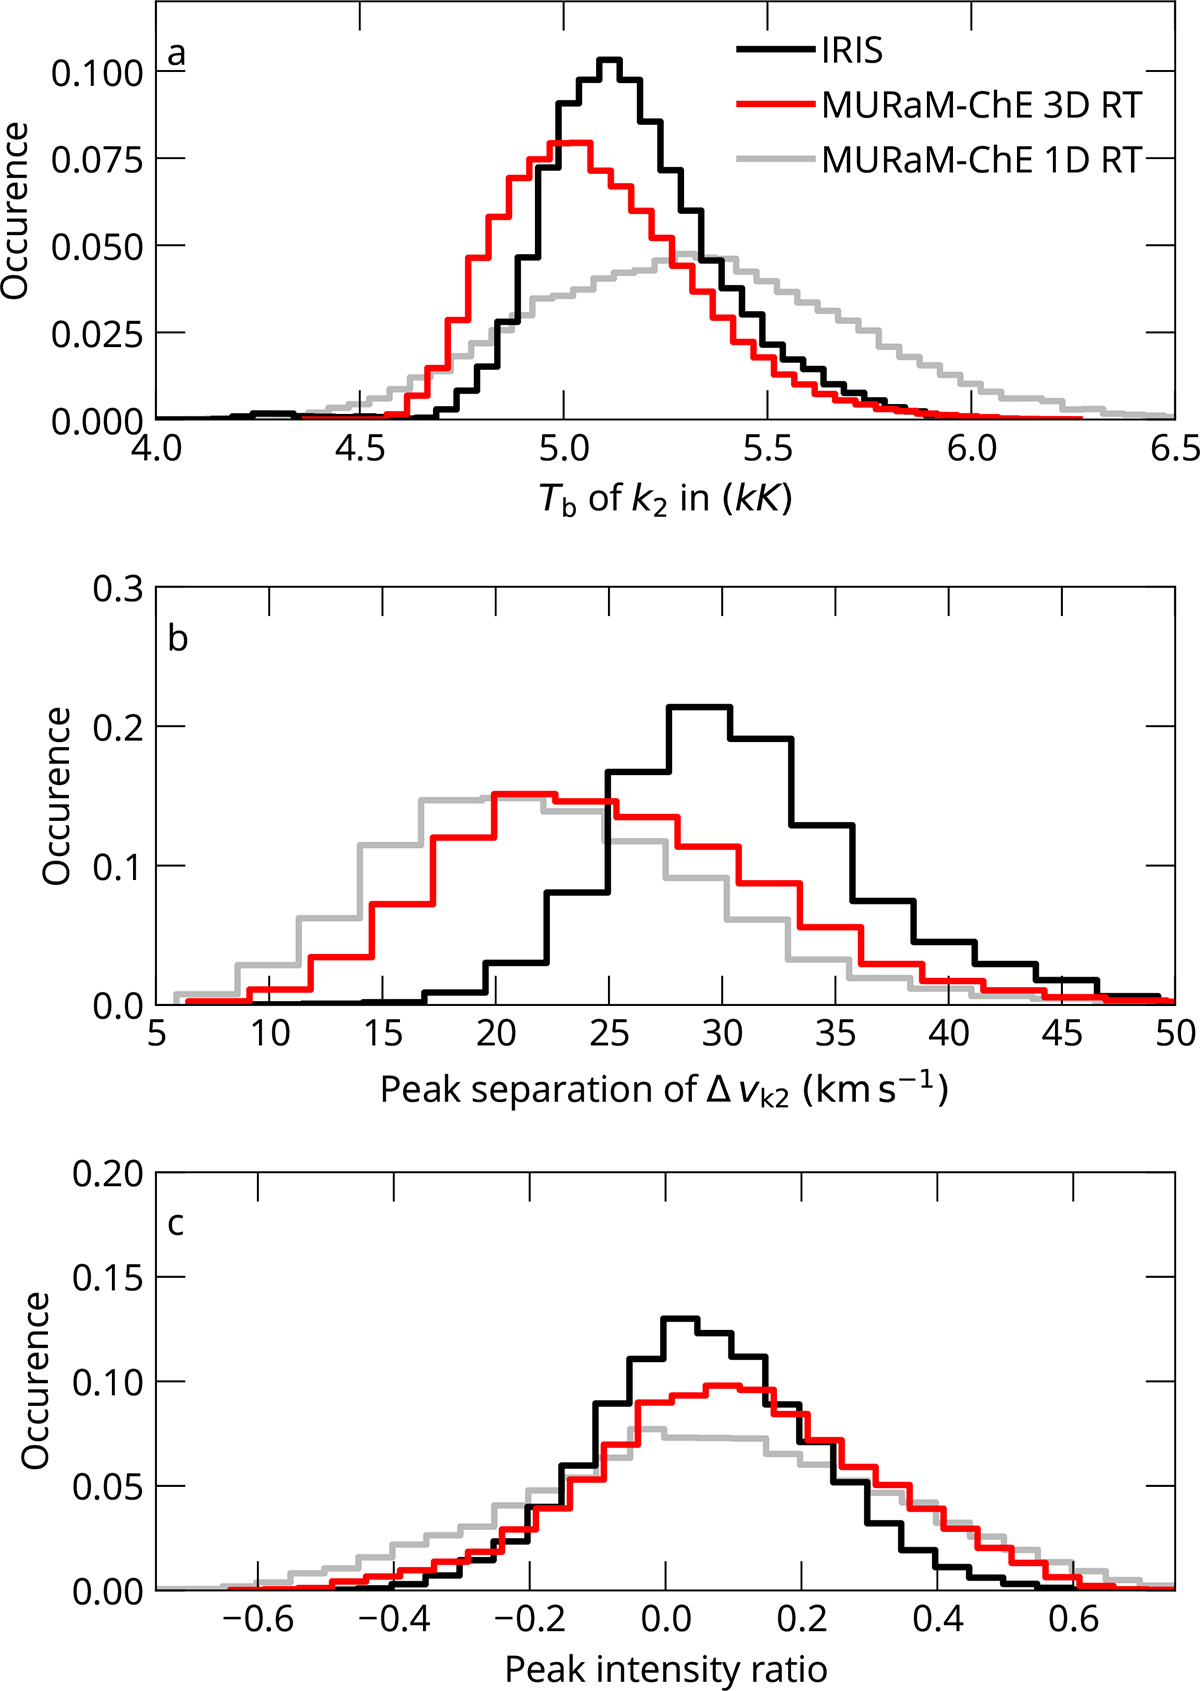
Statistical comparison with observations. In panel (a) we show distributions of the k2 peak brightness temperature, in panel (b) the distribution of k2 peak separation, and in panel (c) the distribution of the k2 peak intensity ratio. We show data from the IRIS observation in black and data from the synthetic spectra computed by 3D RT in red, and 1.5D RT in gray after degradation to instrumental conditions.
Current usage metrics show cumulative count of Article Views (full-text article views including HTML views, PDF and ePub downloads, according to the available data) and Abstracts Views on Vision4Press platform.
Data correspond to usage on the plateform after 2015. The current usage metrics is available 48-96 hours after online publication and is updated daily on week days.
Initial download of the metrics may take a while.