


Fig. 1.
Download original image
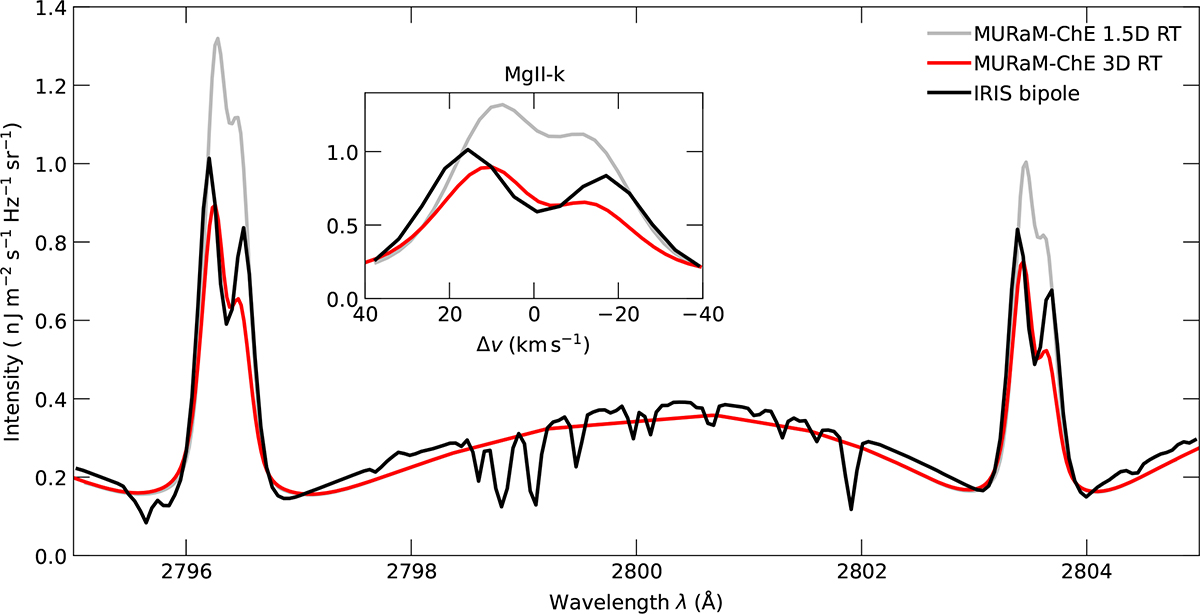
Spatially averaged spectra of the Mg II h&k lines. Shown are the spectra from the MURaM-ChE simulation once computed in full 3D RT (red) and once using the plane-parallel 1.5D RT approximation (gray). For comparison, we show an observation from a qualitatively similar bipolar feature, which covers a similar area on the Sun (black).
Current usage metrics show cumulative count of Article Views (full-text article views including HTML views, PDF and ePub downloads, according to the available data) and Abstracts Views on Vision4Press platform.
Data correspond to usage on the plateform after 2015. The current usage metrics is available 48-96 hours after online publication and is updated daily on week days.
Initial download of the metrics may take a while.