


Fig. 1.
Download original image
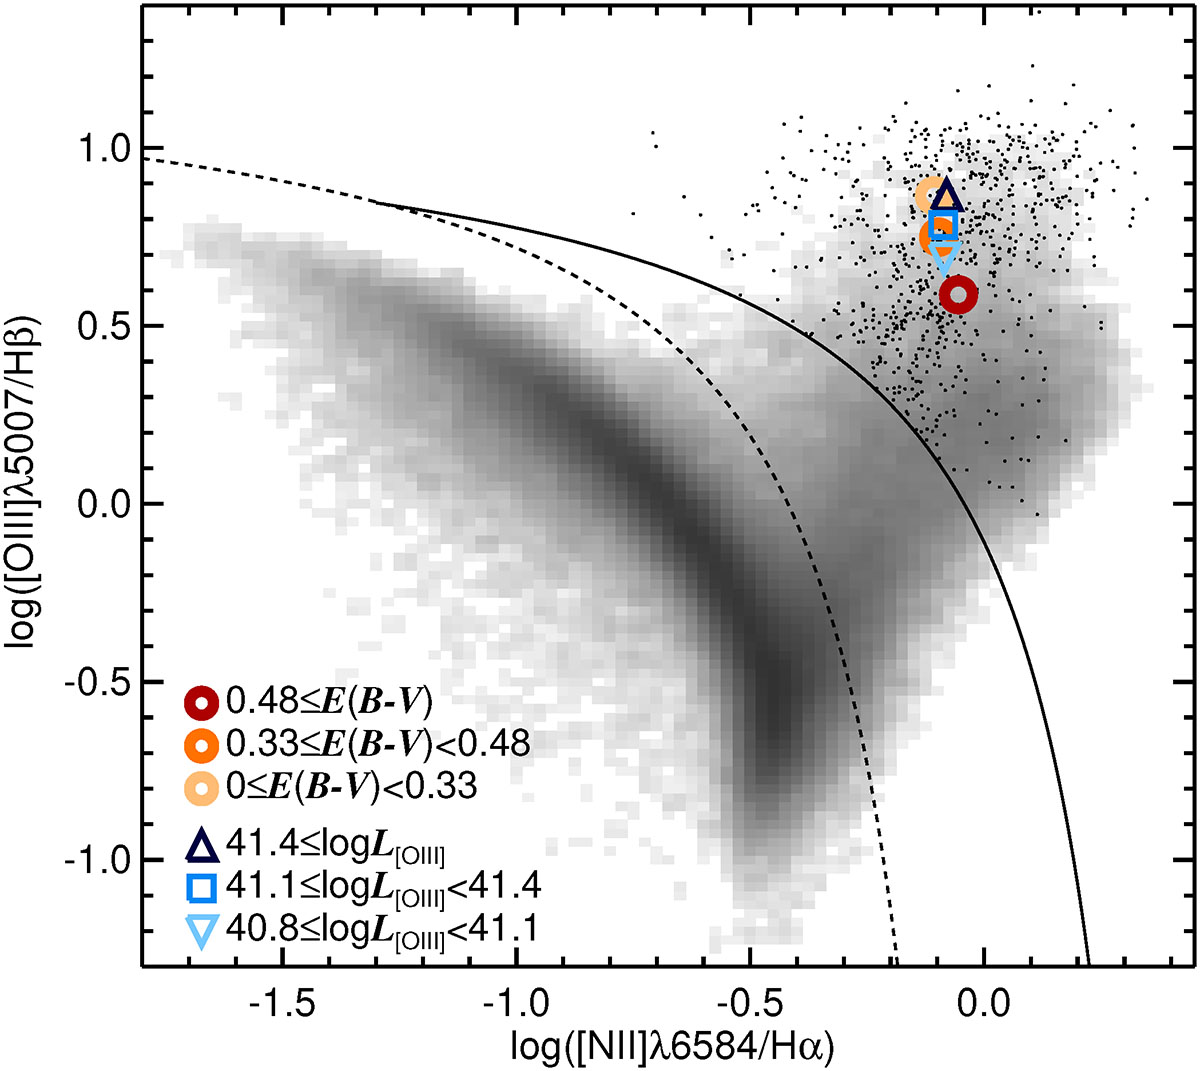
Distribution of galaxies at z < 0.063 in the BPT diagram, which classifies galaxies based on the emission-line flux ratios [O III] λ5007/Hβ and [N II] λ6584/Hα, is shown as a number-density plot in which darker regions indicate a higher density of data points. The dashed line indicates the demarcation defined by Equation (1) in Kauffmann et al. (2003), below which galaxies are classified as star-forming. The solid line represents the classification boundary given by Equation (5) in Kewley et al. (2001), above which galaxies are classified as AGNs. Galaxies located between the two lines are classified as composite, where both star-forming regions and AGNs contribute to the emission-line fluxes. Our 748 type 2 AGNs with log L[O III] ≥ 40.8 are plotted as black circles. The colored symbols mark the median BPT positions of type 2 AGNs in bins of E(B − V) and L[O III] (an indicator of AGN luminosity), where each symbol is plotted at the median values of [N II] λ6584/Hα and [O III] λ5007/Hβ for the AGNs in that bin. Different symbols and colors denote different bins. L[O III] is in units of erg s−1.
Current usage metrics show cumulative count of Article Views (full-text article views including HTML views, PDF and ePub downloads, according to the available data) and Abstracts Views on Vision4Press platform.
Data correspond to usage on the plateform after 2015. The current usage metrics is available 48-96 hours after online publication and is updated daily on week days.
Initial download of the metrics may take a while.