


Open Access
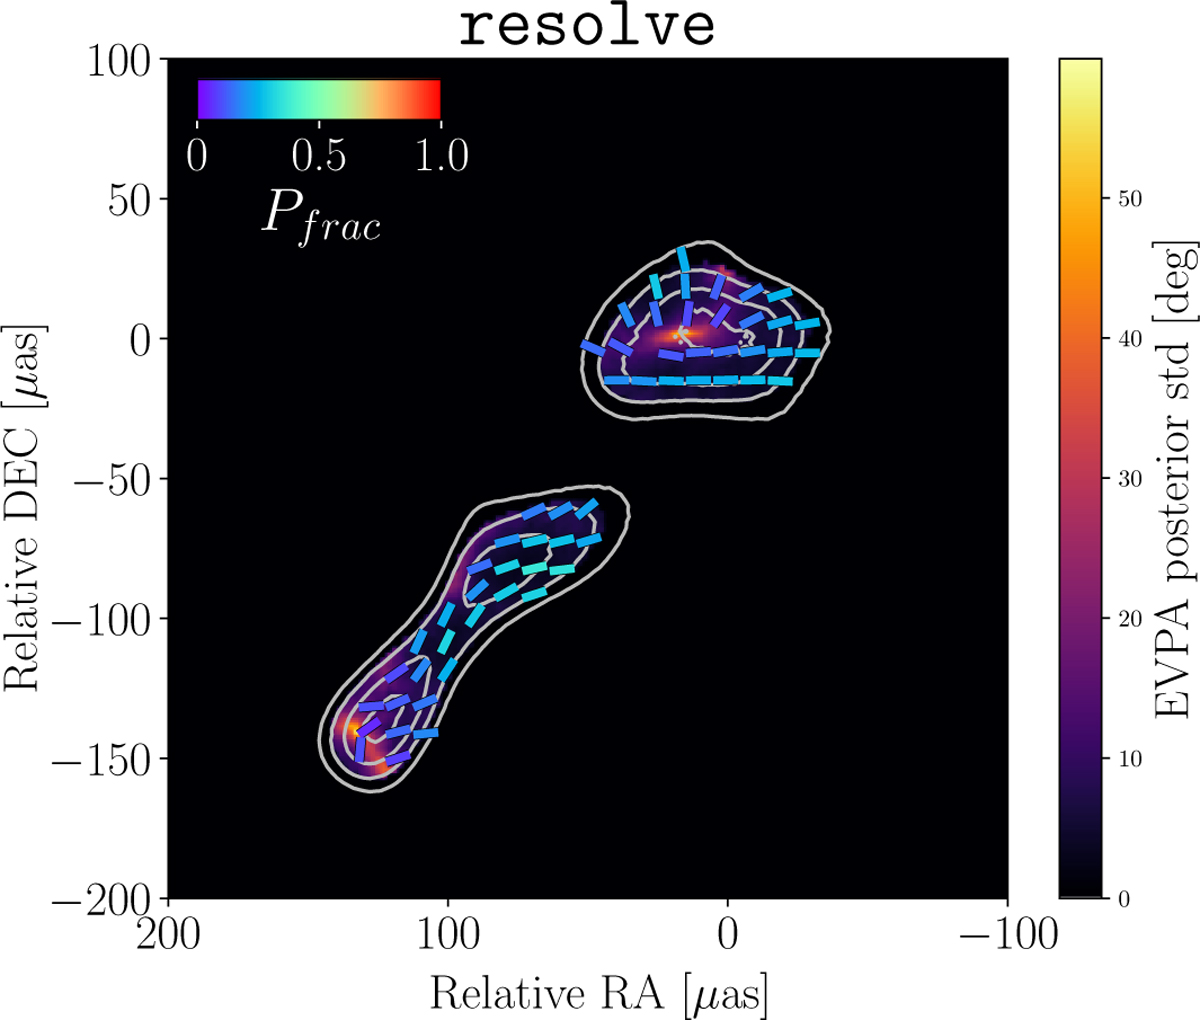
Fig. D.2
Download original image
EVPA posterior standard deviation map of the OJ287 GMVA+ALMA observation at 86GHz using resolve. The contours representing the total intensity resolve posterior mean image increase by a factor of 2, starting from 10% of the peak resolve posterior mean total intensity.
Current usage metrics show cumulative count of Article Views (full-text article views including HTML views, PDF and ePub downloads, according to the available data) and Abstracts Views on Vision4Press platform.
Data correspond to usage on the plateform after 2015. The current usage metrics is available 48-96 hours after online publication and is updated daily on week days.
Initial download of the metrics may take a while.