


Fig. 3
Download original image
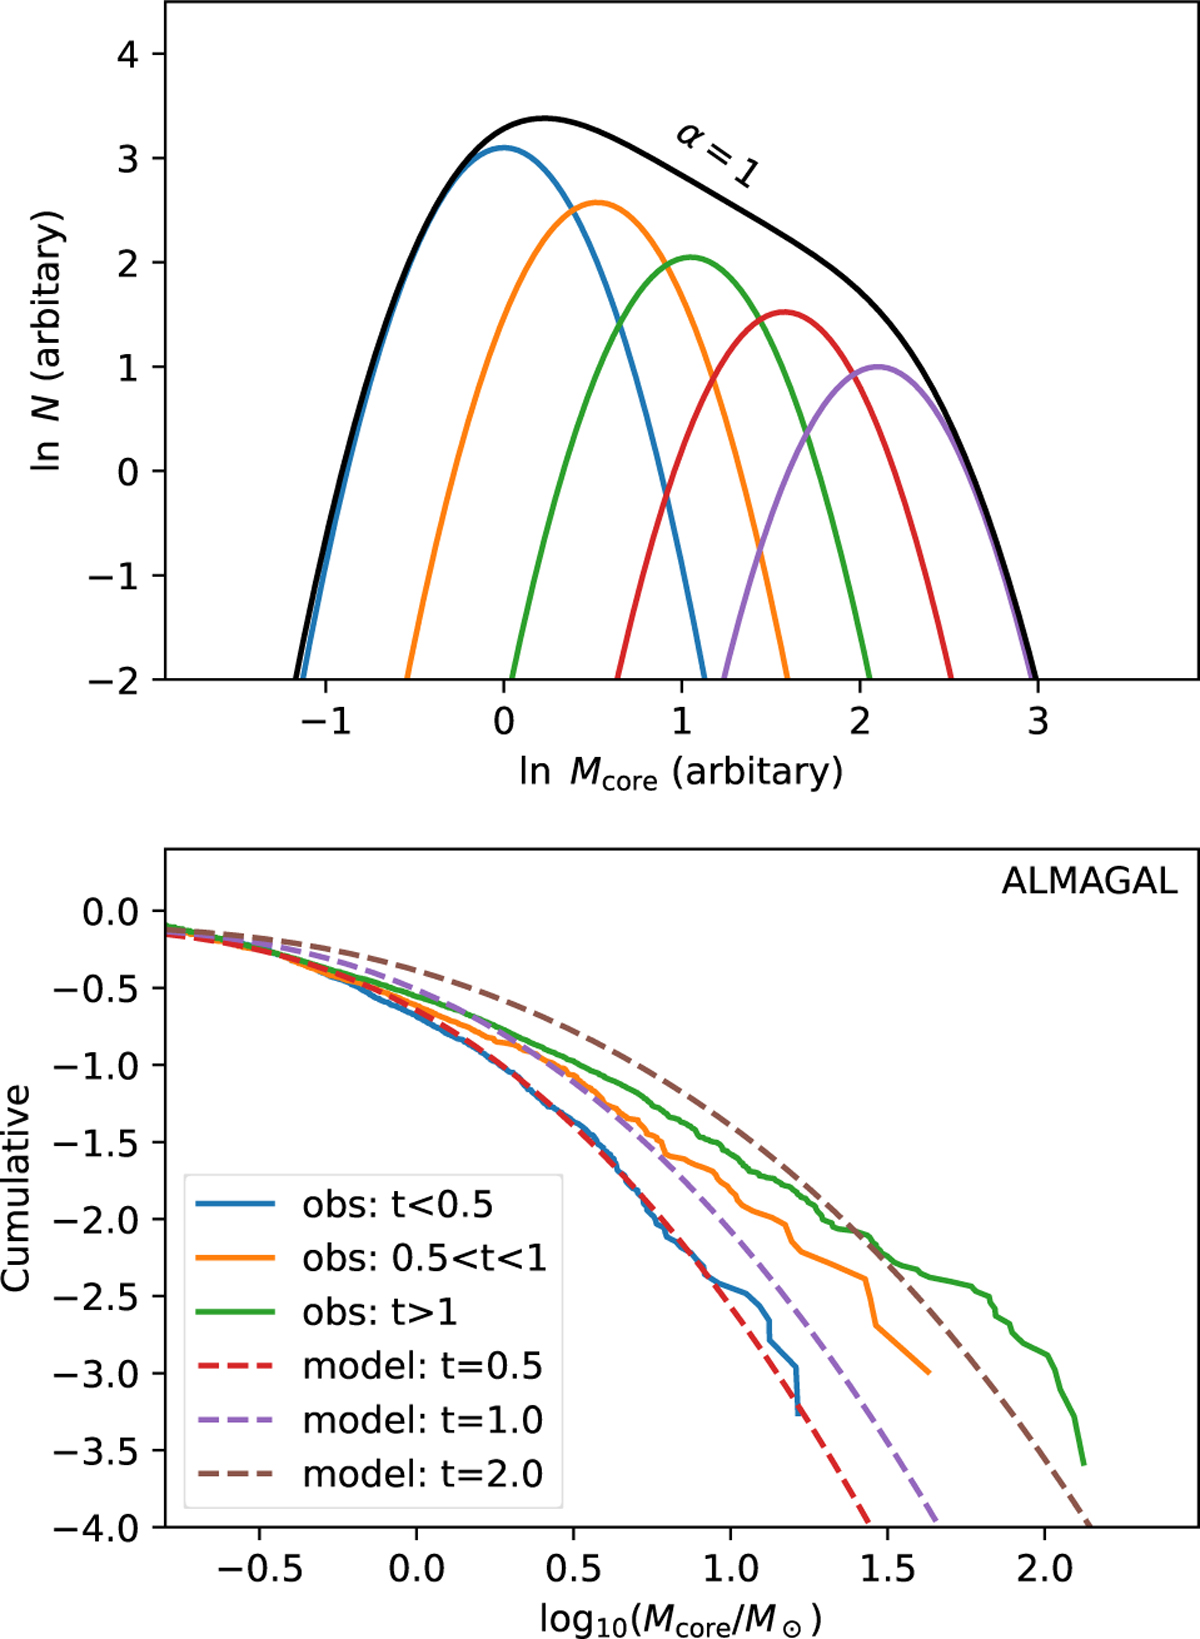
Upper: schematic illustration showing how shifted ICMFs (colored curves) combine to produce a top-heavy CMF (black curve). The upper shifted ICMFs represent newly formed cores, while the accretion process shifts the mass function of older cores toward higher masses, forming right-shifted ICMFs. Lower: cumulative functions of the observed CMFs for three time bins, together with the corresponding modeled CMFs (see upper panel), where the x axis values are linearly scaled to match the observations.
Current usage metrics show cumulative count of Article Views (full-text article views including HTML views, PDF and ePub downloads, according to the available data) and Abstracts Views on Vision4Press platform.
Data correspond to usage on the plateform after 2015. The current usage metrics is available 48-96 hours after online publication and is updated daily on week days.
Initial download of the metrics may take a while.