


Fig. 2
Download original image
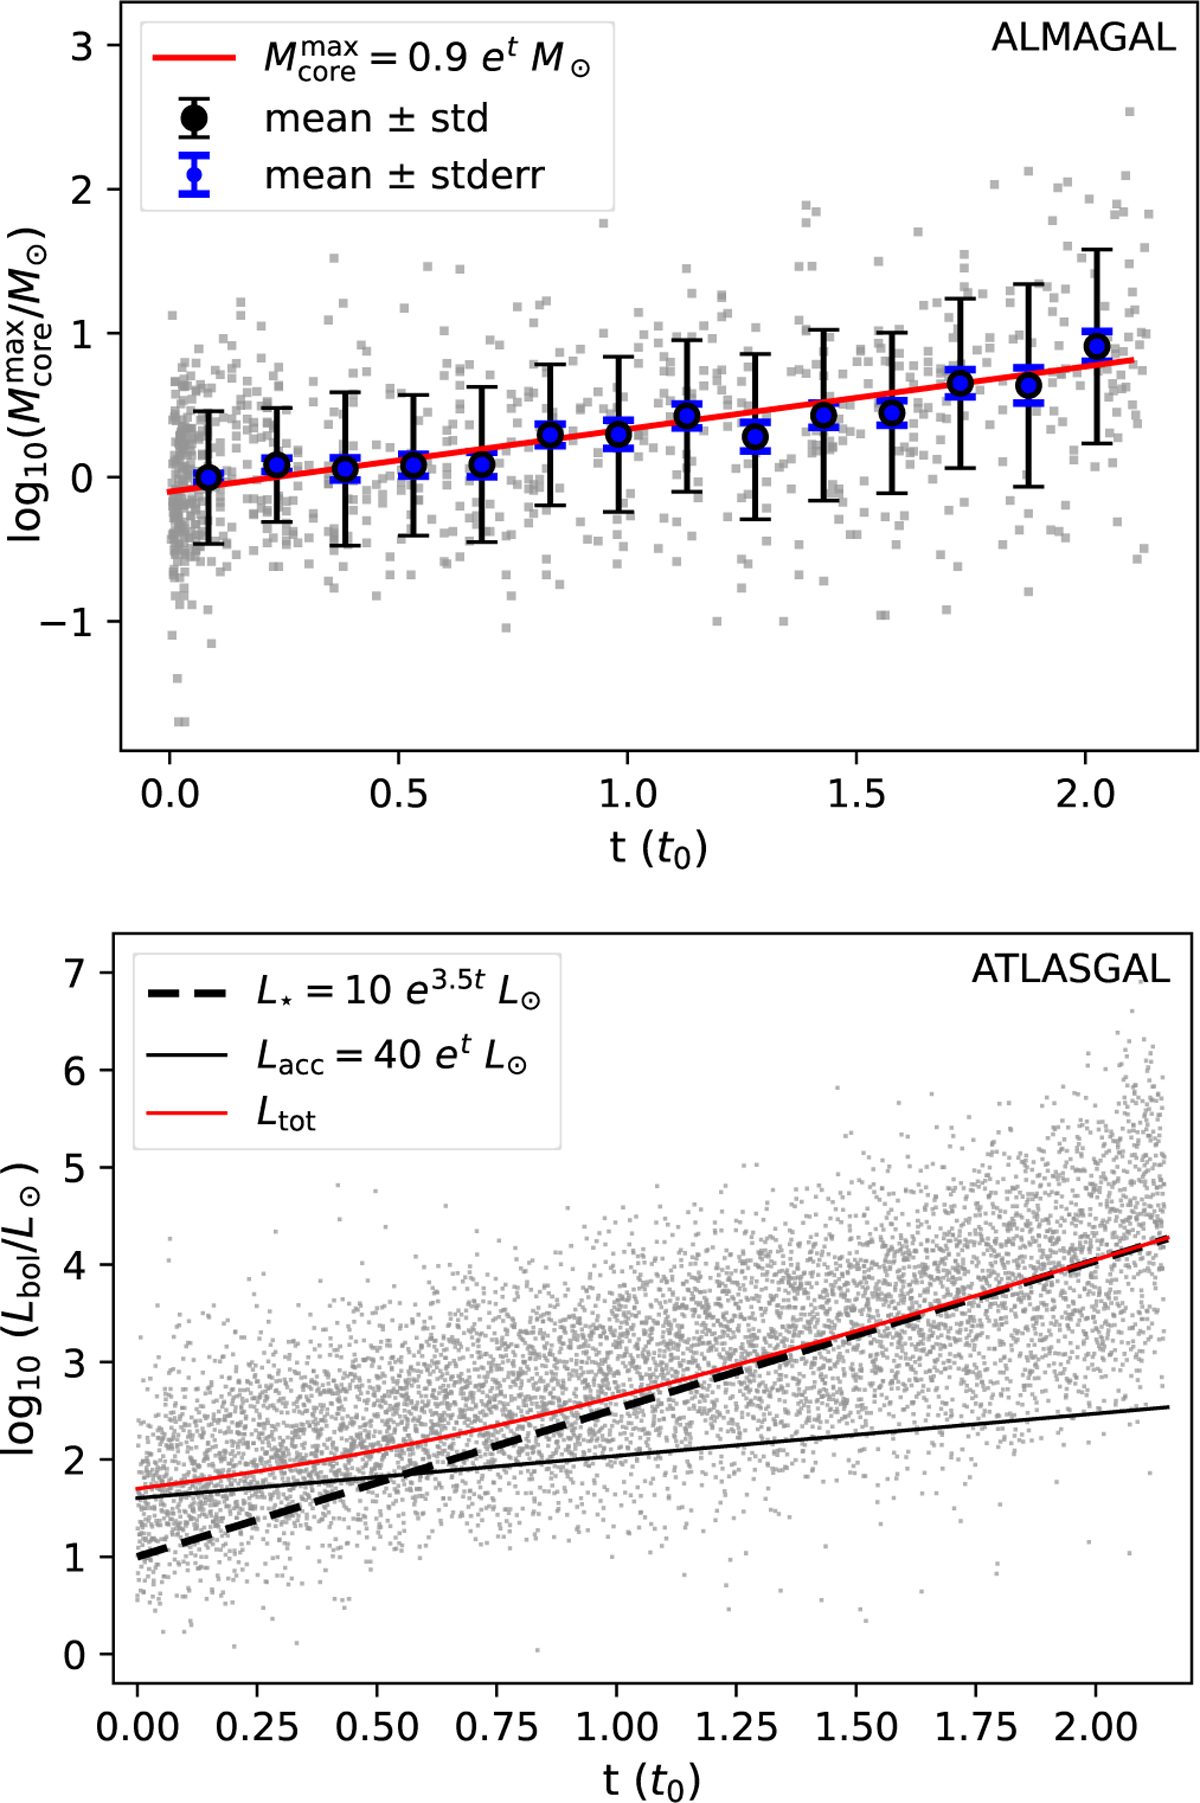
Upper: distribution of  as a function of t for the ALMAGAL sample. Black error bars indicate the mean and standard deviation of
  within each time bin, while blue error bars represent the standard error of the mean (i.e., stderr = std/√N, with N being the number of sources in each bin). The red line shows the exponential fit between
  and t. Lower: distribution of Lbol as a function of t for the ATLASGAL sample. The red line represents the best-fit model of Eq. (13). The dashed and solid black lines indicate the contributions from intrinsic stellar luminosity and accretion luminosity, respectively (see Sect. 3.3).
Current usage metrics show cumulative count of Article Views (full-text article views including HTML views, PDF and ePub downloads, according to the available data) and Abstracts Views on Vision4Press platform.
Data correspond to usage on the plateform after 2015. The current usage metrics is available 48-96 hours after online publication and is updated daily on week days.
Initial download of the metrics may take a while.