


Fig. 2
Download original image
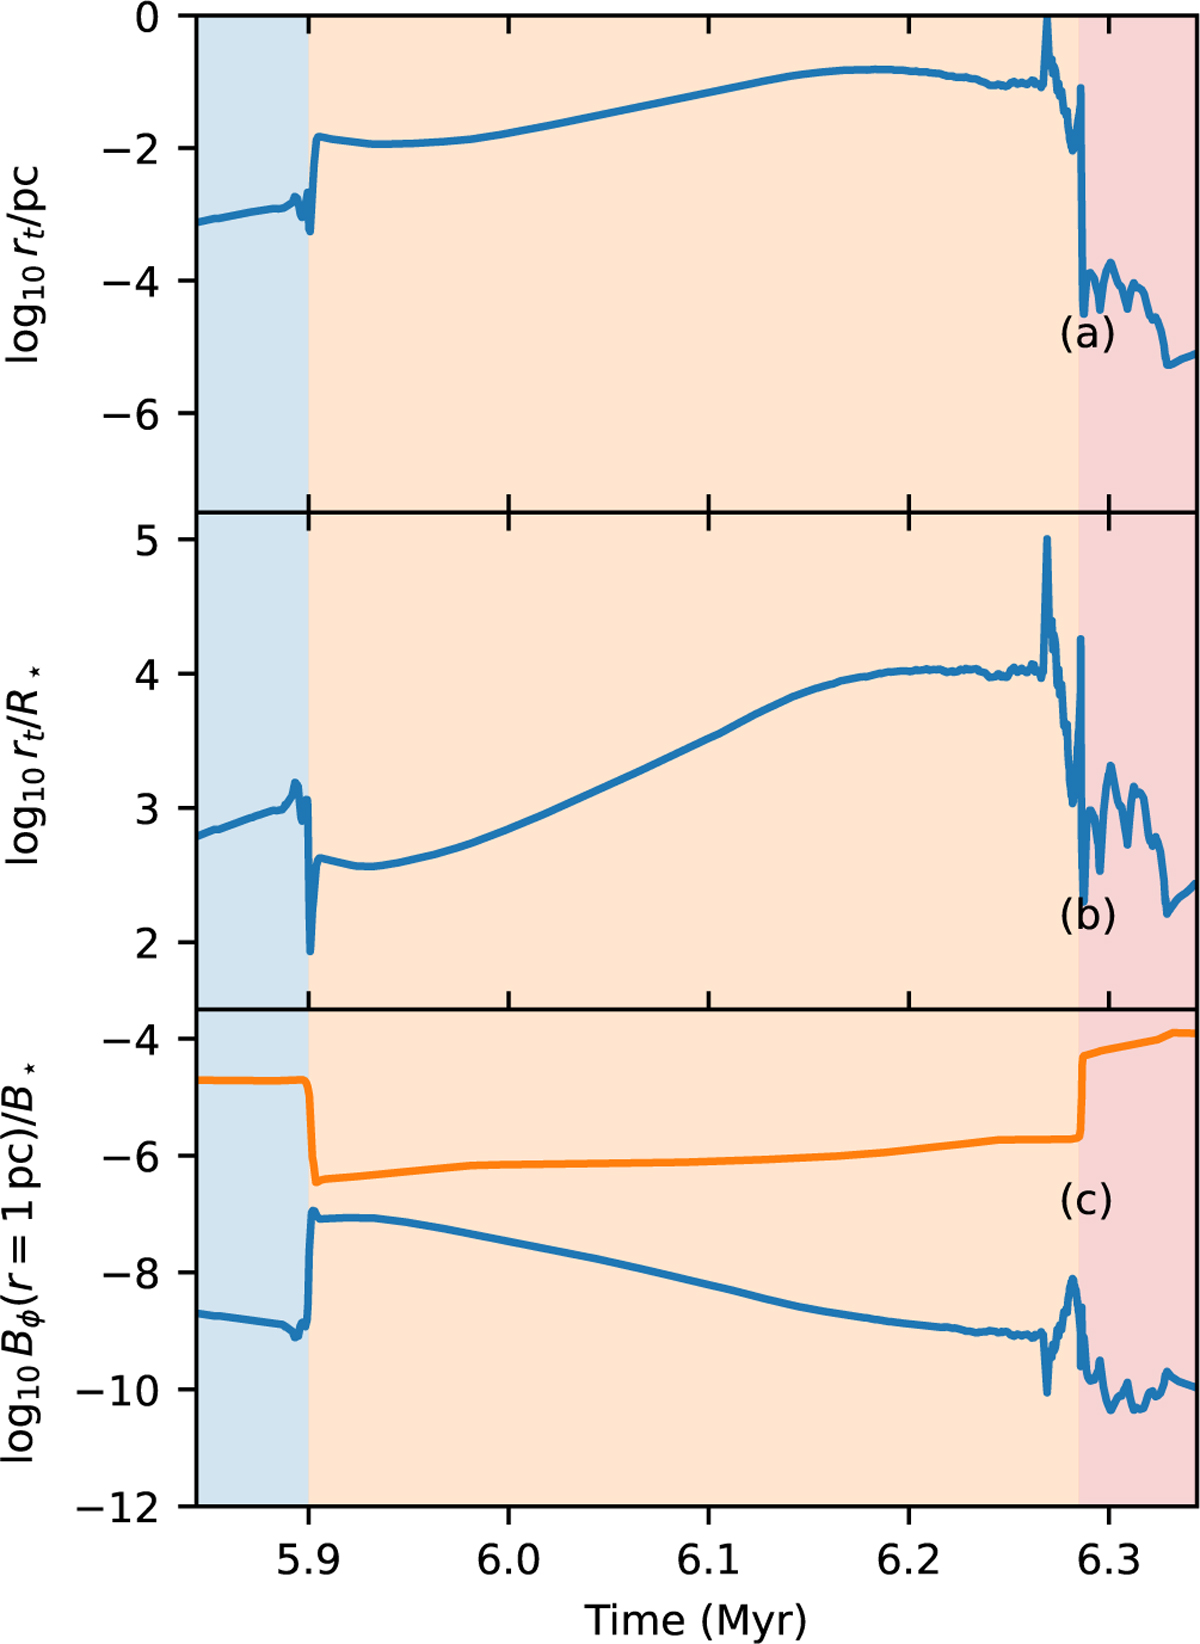
Evolution of selected CSM magnetic field components for the last 500 kyr pre-SN. The blue, orange and red shading denote the MS, RSG and WR phases respectively. (a) Time evolution of rt, the radius where Br/Bϕ = 1 close to the equatorial plane. (b) Time evolution of rt/R⋆. (c) Time evolution of Bϕ/B⋆, where Bϕ is calculated at a distance of 1 pc from the star, for our model (blue) and with values of Zirakashvili & Ptuskin (2018) (orange). Note while R⋆ is time dependent, B⋆ is assumed to be fixed.
Current usage metrics show cumulative count of Article Views (full-text article views including HTML views, PDF and ePub downloads, according to the available data) and Abstracts Views on Vision4Press platform.
Data correspond to usage on the plateform after 2015. The current usage metrics is available 48-96 hours after online publication and is updated daily on week days.
Initial download of the metrics may take a while.