


Fig. 9.
Download original image
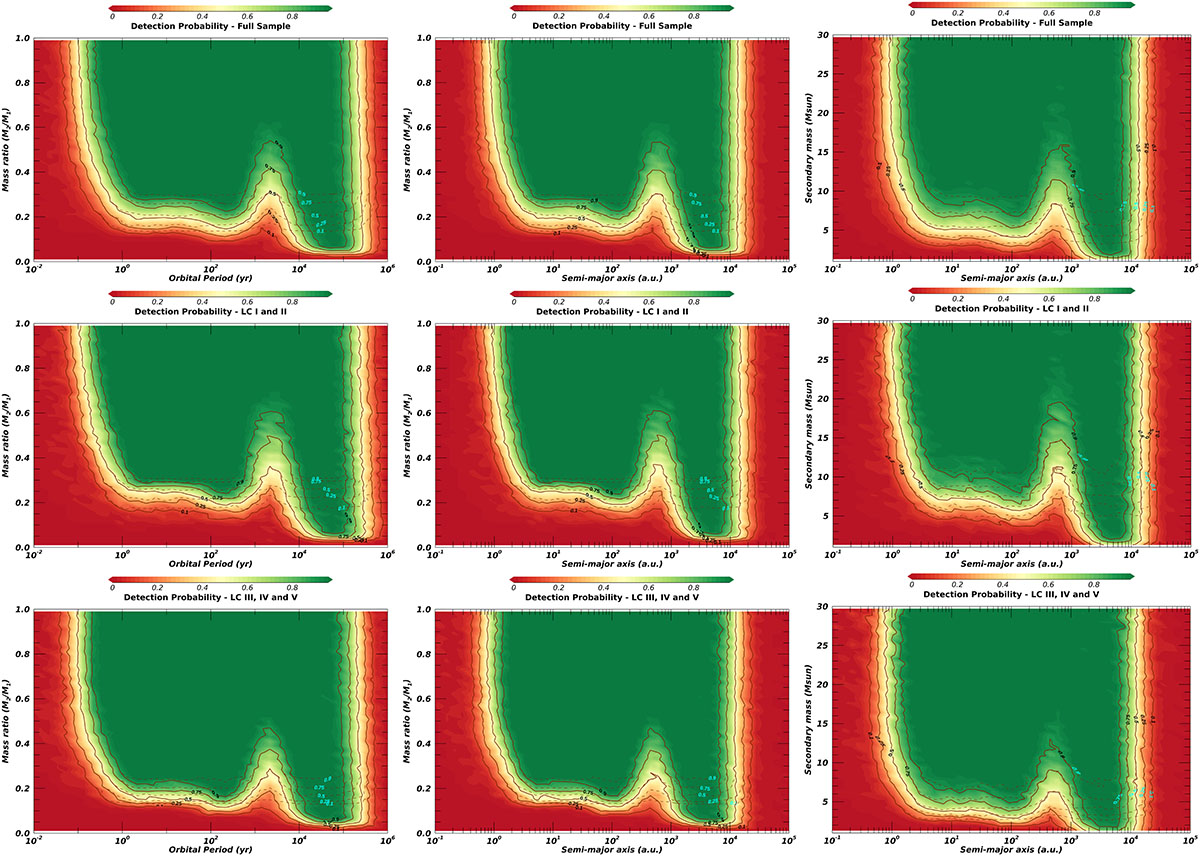
Binary detection probabilities of the SMASH+ survey projected on the mass ratio versus the orbital period (left), versus the semi-major axis (middle), and the companion mass versus the semi-major axis (right) planes. The colored background and solid equi-probability curves are based on the sample of stars that have been observed both by PIONIER and by NACO. The dashed equi-probability curves (and cyan labels) show the detectability when restricting the sample to ΔH ≤ 4 (i.e., the “cleaned” sample). From top to bottom: the full sample, luminosity classes I and II, and luminosity classes III to V.
Current usage metrics show cumulative count of Article Views (full-text article views including HTML views, PDF and ePub downloads, according to the available data) and Abstracts Views on Vision4Press platform.
Data correspond to usage on the plateform after 2015. The current usage metrics is available 48-96 hours after online publication and is updated daily on week days.
Initial download of the metrics may take a while.