


Fig. 10
Download original image
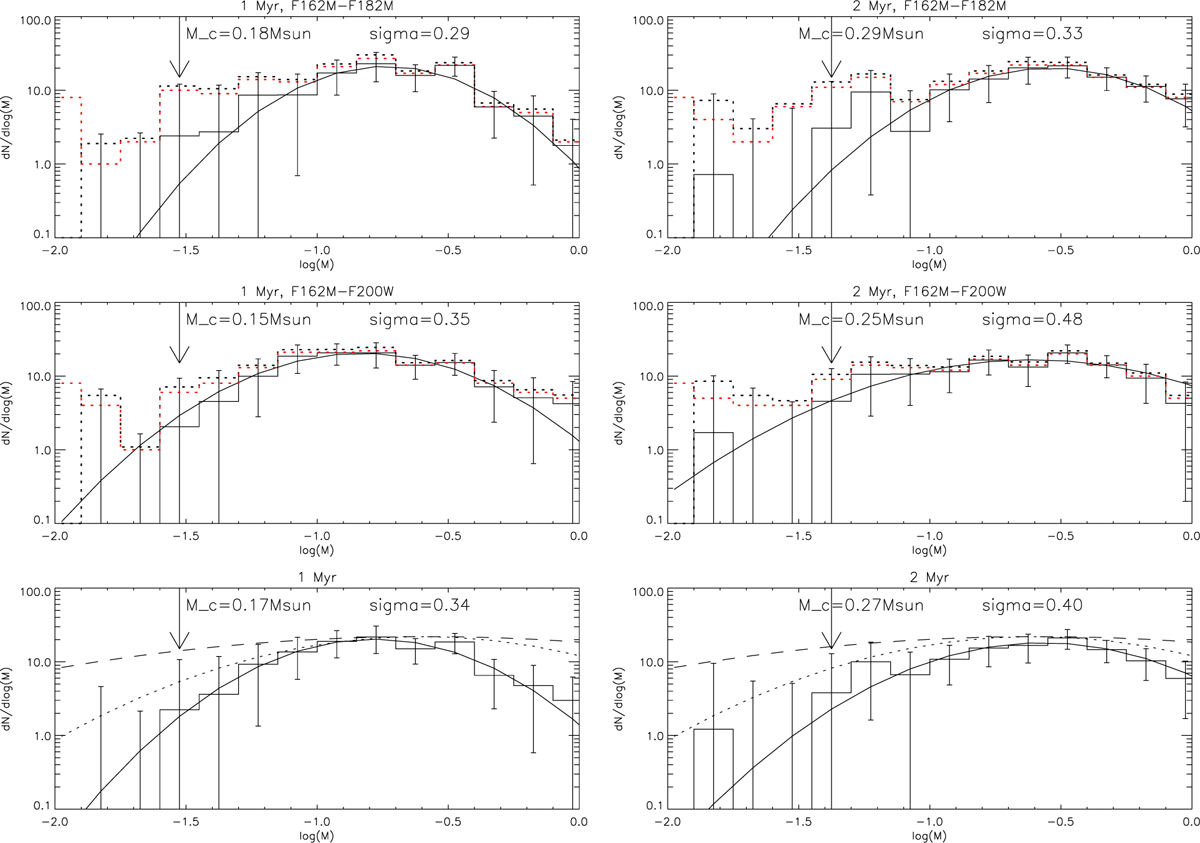
IMF for the annulus 200–1000 pixels from the cluster center. Both the F162M-F182M vs. F162M and F162M–F200W vs. F200W CMDs were used for the mass estimates of individual sources and ages of 1 and 2 Myr solar metallicity isochrones were adopted. The limit of the fits, i.e., the 60% completeness limit, is shown as an arrow in each diagram and is 0.03 M⊙ and 0.04 M⊙ for ages of 1 and 2 Myr, respectively. In each plot the dotted histogram shows the completeness-corrected IMF before field subtraction and the solid lined histogram the field-star-corrected IMF. The dotted red lines show the histogram for the cluster field before completeness correction and field subtraction. The two bottom panels are the average of the two filter combinations. Overplotted are the Chabrier (2005) IMF as a dotted line as well as the ONC IMF determined by Gennaro & Robberto (2020) as a dashed line.
Current usage metrics show cumulative count of Article Views (full-text article views including HTML views, PDF and ePub downloads, according to the available data) and Abstracts Views on Vision4Press platform.
Data correspond to usage on the plateform after 2015. The current usage metrics is available 48-96 hours after online publication and is updated daily on week days.
Initial download of the metrics may take a while.