


Fig. 4.
Download original image
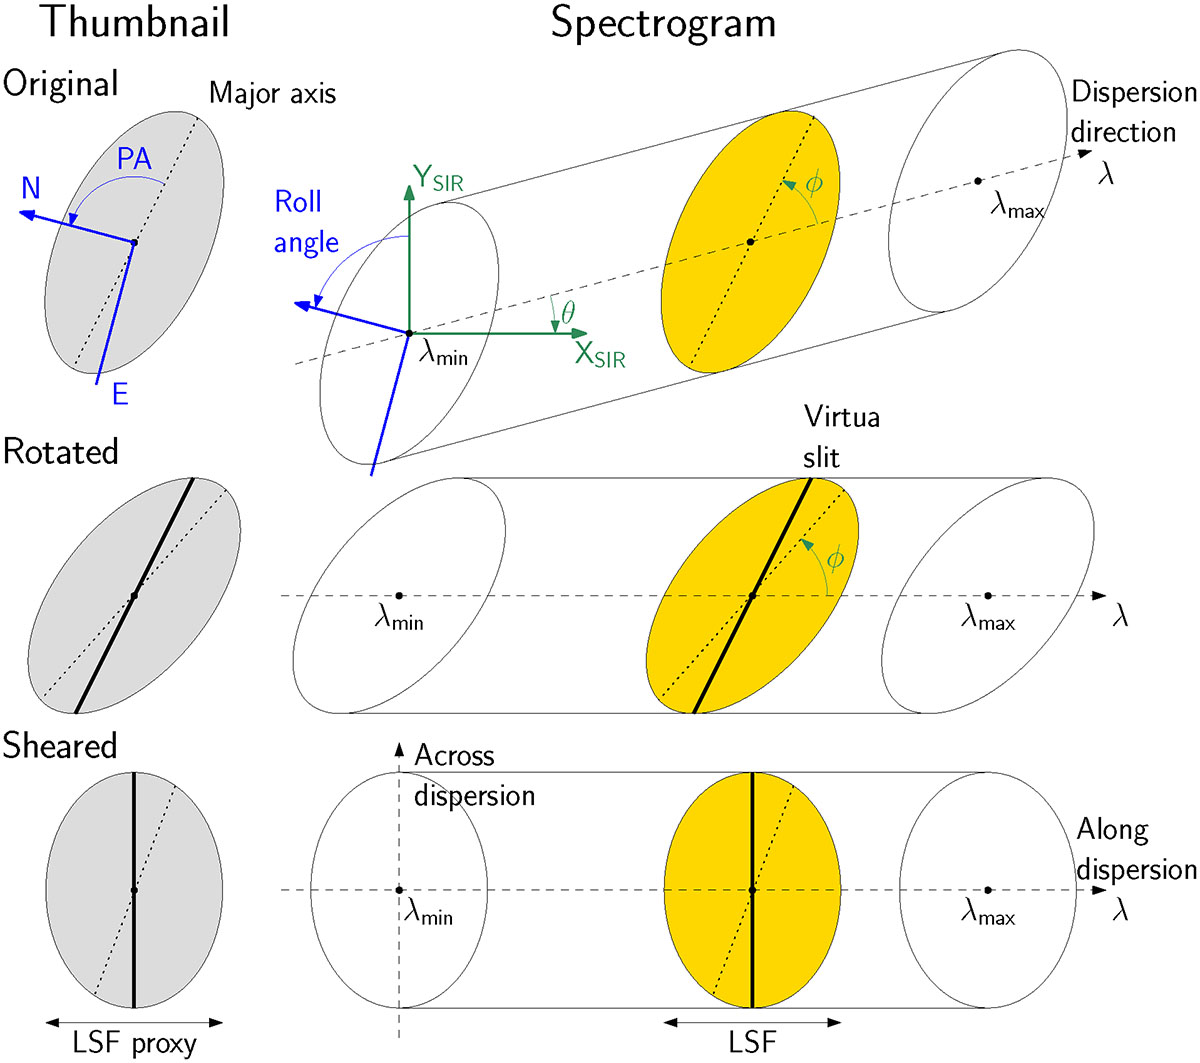
Illustration of the different steps in the extraction of a spectrogram (right) of an extended source along its photometry thumbnail (left). Top: Original orientation in the FP. Middle: Rotation to bring the dispersion direction to horizontal. Bottom: Shear to bring the virtual slit along the cross-dispersion direction and minimise self-contamination. This illustration is a simplified case with no initial tilt or curvature in the spectral trace. In practice, rotation and shear are performed in a single step to minimise correlations between resampled pixels.
Current usage metrics show cumulative count of Article Views (full-text article views including HTML views, PDF and ePub downloads, according to the available data) and Abstracts Views on Vision4Press platform.
Data correspond to usage on the plateform after 2015. The current usage metrics is available 48-96 hours after online publication and is updated daily on week days.
Initial download of the metrics may take a while.