


Fig. 3.
Download original image
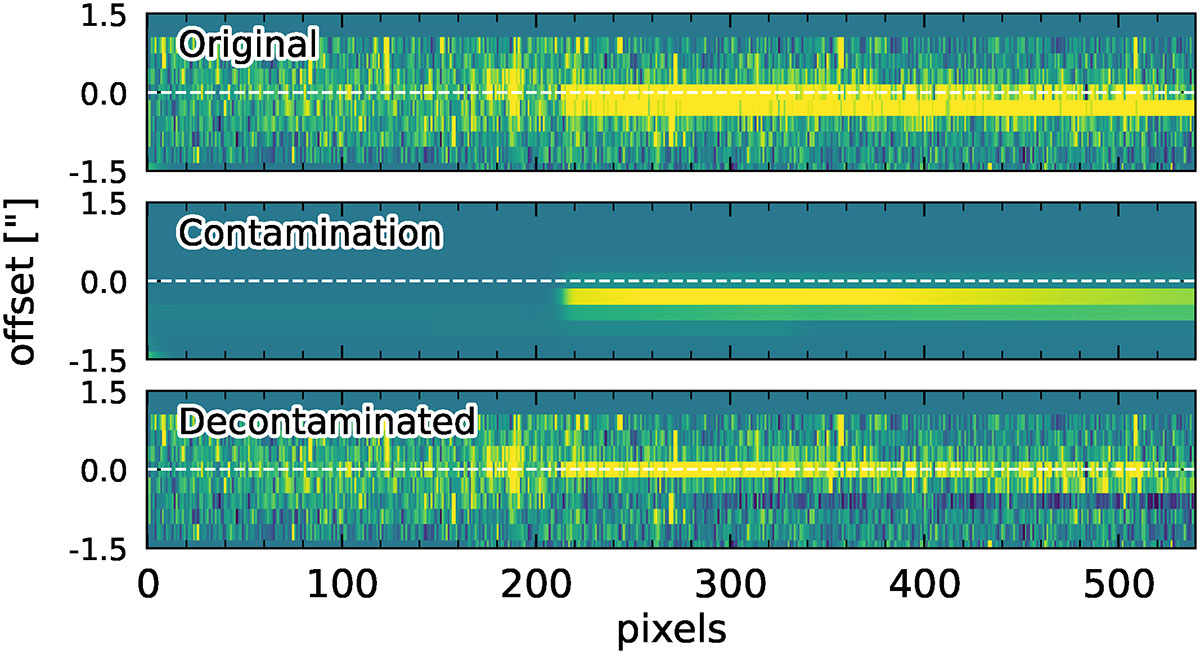
Illustration of the decontamination procedure for a line-emitting source. Top: Original RGS000+0 spectrogram of object ID 2709725257636288279 in SIR coordinates: the x-axis is the dispersion direction, and the y-axis is the cross-dispersion direction. Middle: Model for the bright contaminant created in this case from broadband photometry, which affects a part of the target spectrogram. Bottom: Decontaminated spectrogram of the source of interest (positioned along the white dashed line). The flux scaling of all panels is the same. We note that the decontamination procedure was successful at isolating the target spectrogram, even if a faint subtraction residual is still visible in this particular case.
Current usage metrics show cumulative count of Article Views (full-text article views including HTML views, PDF and ePub downloads, according to the available data) and Abstracts Views on Vision4Press platform.
Data correspond to usage on the plateform after 2015. The current usage metrics is available 48-96 hours after online publication and is updated daily on week days.
Initial download of the metrics may take a while.