


Fig. A.1.
Download original image
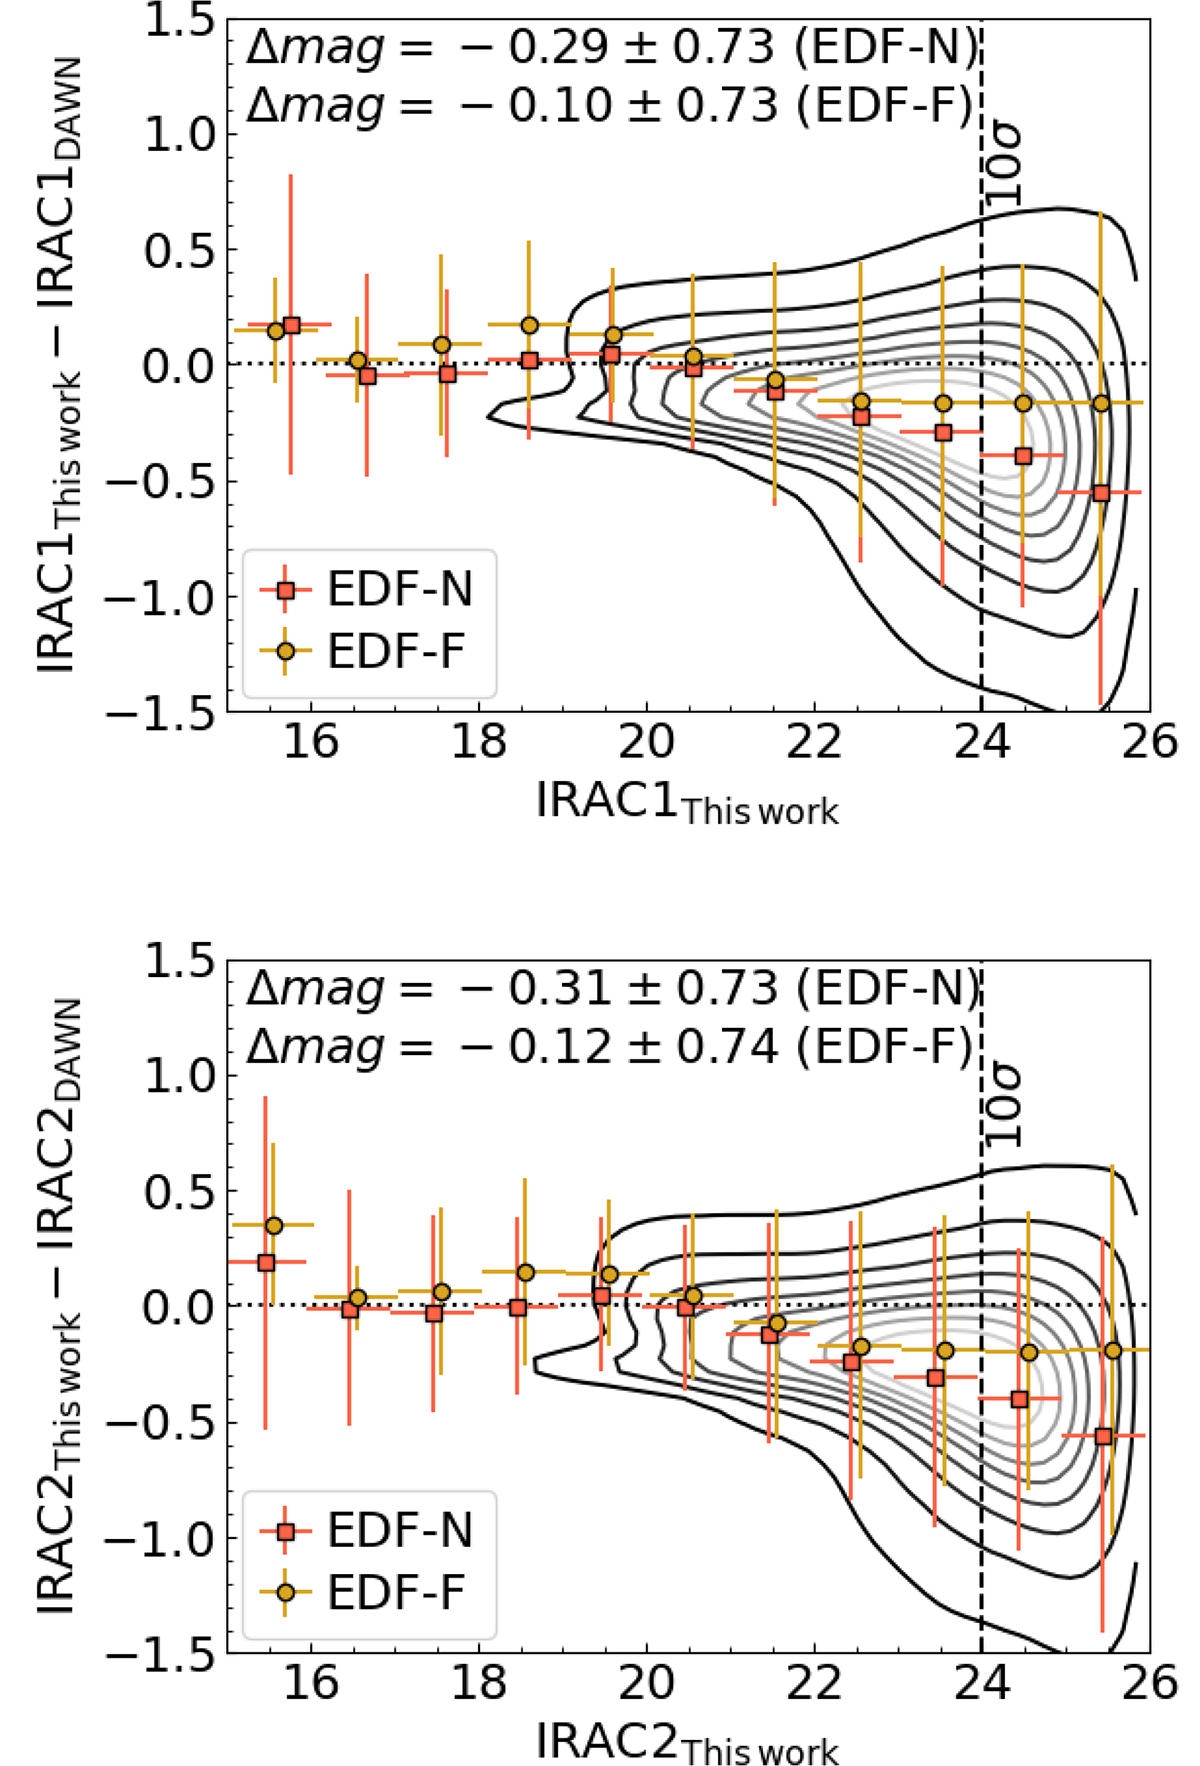
Difference between the magnitudes derived in this work and the ones in the Cosmic Dawn Catalogue. The black contours show the distribution of all sources in common between the two catalogues (from 10% to 90% of the sample), and red squares and yellow circles show the average values in magnitude bins for the EDF-N and EDF-F, respectively. We report in the top left the mean and standard deviation of the difference in magnitude in the two fields. We report results for the IRAC1 filter on the top and the IRAC2 filter on the bottom panel.
Current usage metrics show cumulative count of Article Views (full-text article views including HTML views, PDF and ePub downloads, according to the available data) and Abstracts Views on Vision4Press platform.
Data correspond to usage on the plateform after 2015. The current usage metrics is available 48-96 hours after online publication and is updated daily on week days.
Initial download of the metrics may take a while.