


Fig. 6.
Download original image
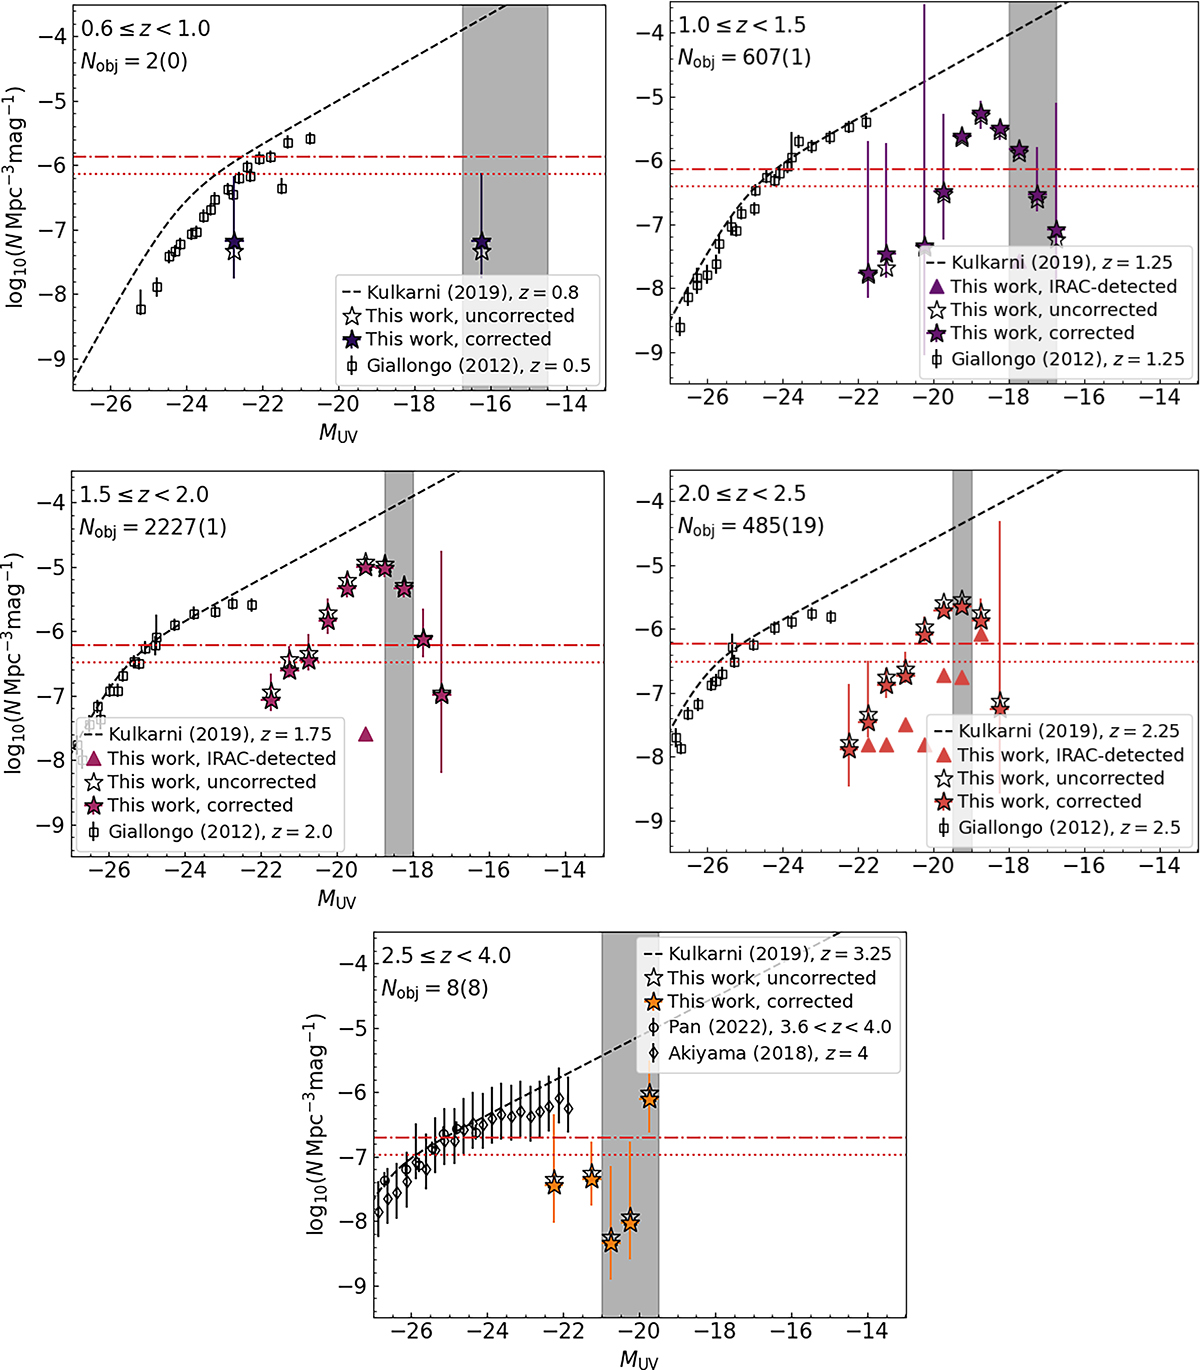
UV luminosity function of the LRD candidates from z = 0 (top left) to z = 4 (bottom right). The empty stars indicate the values before any corrections, and the coloured stars show the density after correcting for completeness and redshift estimation. The coloured triangles show the conservative estimation derived considering only IRAC-detected sources. The vertical shaded black regions show the range of the 80% completeness in the three fields. In the top left corner, we report the number of objects inside the redshift bin, and we show the number of IRAC-detected sources in the bin in brackets. The empty symbols show UV luminosity functions of QSOs from Giallongo et al. (2012, and reference therein), Akiyama et al. (2018), and Pan et al. (2022). We also report the UV luminosity function of QSOs modelled by Kulkarni et al. (2019, dashed black line). For a comparison, the horizontal dash-dotted red line shows the minimum density probed by the HST CANDELS survey (0.29 deg2Grogin et al. 2011; Koekemoer et al. 2011), and the horizontal dotted red line shows the minimum density probed by the JWST COSMOS-WEB survey (0.54 deg2 Casey et al. 2023).
Current usage metrics show cumulative count of Article Views (full-text article views including HTML views, PDF and ePub downloads, according to the available data) and Abstracts Views on Vision4Press platform.
Data correspond to usage on the plateform after 2015. The current usage metrics is available 48-96 hours after online publication and is updated daily on week days.
Initial download of the metrics may take a while.