


Fig. 4.
Download original image
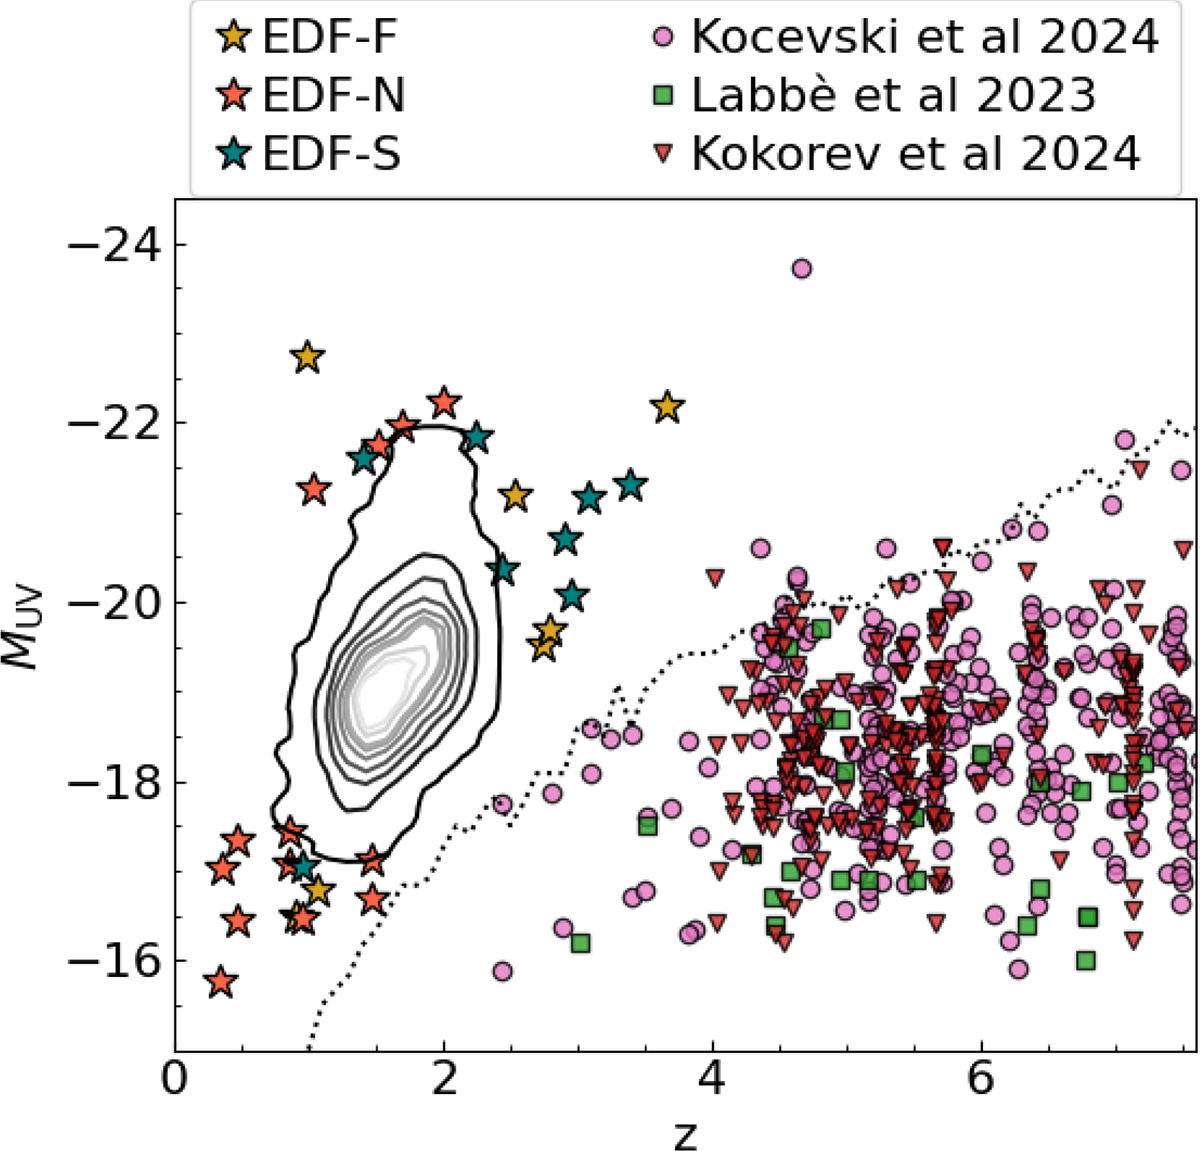
MUV and redshift for all LRD candidates, shown as contour lines, equally spaced from 10% to 90%. The last line represents 99% of the distribution. The remaining 1% of the sample is shown with stars, colour-coded based on their field. We also show three samples of LRDs selected with JWST observations (Kocevski et al. 2025; Labbé et al. 2023; Kokorev et al. 2024a; Akins et al. 2024). The dotted black line shows the 80% completeness that is expected when the EDFs are at their final depth.
Current usage metrics show cumulative count of Article Views (full-text article views including HTML views, PDF and ePub downloads, according to the available data) and Abstracts Views on Vision4Press platform.
Data correspond to usage on the plateform after 2015. The current usage metrics is available 48-96 hours after online publication and is updated daily on week days.
Initial download of the metrics may take a while.