


Fig. A.4.
Download original image
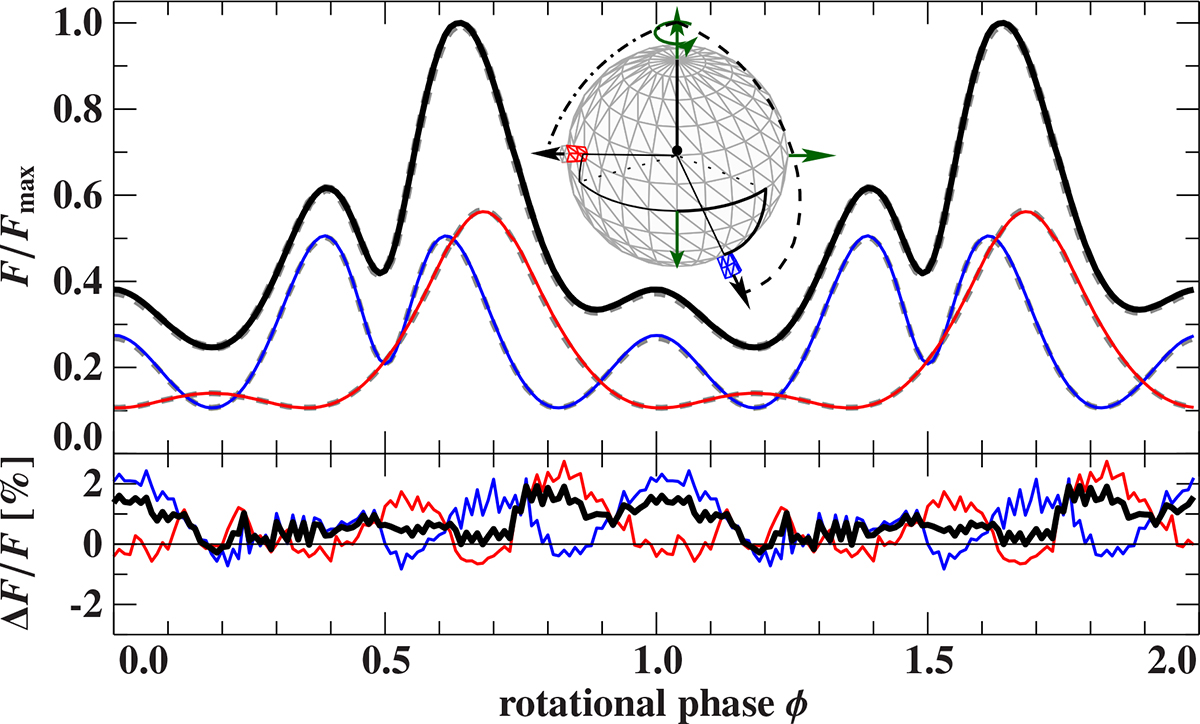
Normalized pulse profiles in comparison. Dashed gray lines relate to calculations by Ferrigno et al. (2011, bottom right panel in their Fig. 9) and solid lines to the numerical ray tracing method presented here. Red and blue corresponds to the contribution of the two conical accretion columns with N1 = N2 = 100 positioned asymmetrically at (ΘAC1 = 74°, ΦAC1 = 178°) and (ΘAC2 = 148°, ΦAC2 = 293°), respectively, as shown by the inset. The lower panel shows the corresponding relative differences of the two ray tracing models. Both columns have a height of 2 km and an opening angle of 4°. The neutron star of mass 1.4 M⊙ and radius 10 km is seen under an inclination of i = 60°.
Current usage metrics show cumulative count of Article Views (full-text article views including HTML views, PDF and ePub downloads, according to the available data) and Abstracts Views on Vision4Press platform.
Data correspond to usage on the plateform after 2015. The current usage metrics is available 48-96 hours after online publication and is updated daily on week days.
Initial download of the metrics may take a while.