


Fig. A.2.
Download original image
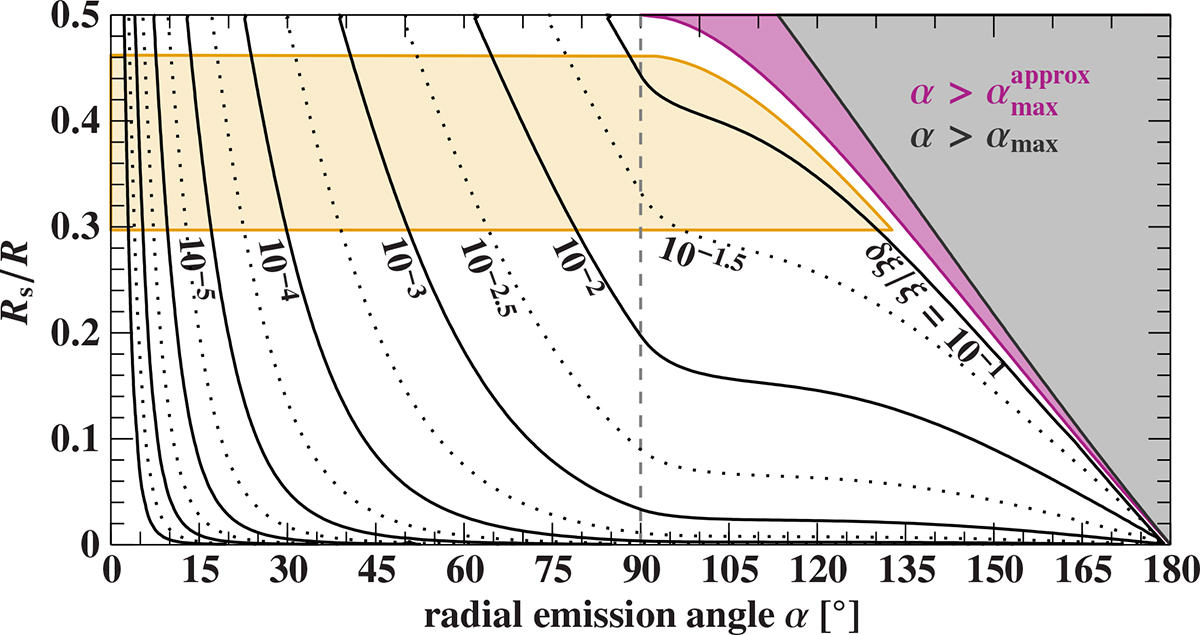
Accuracy of the analytical photon trajectory approximation (Eq. A.14). This figure is similar to Beloborodov (2002, Fig. 2) and shows contour lines (solid, dotted) of constant deviation δξ/ξ of the bending angle ξ = Ψ − α of the analytical approximation (Eq. A.14) to the exact solution (Eq. A.13). The black and purple shaded regions relate to the maximum radial emission angles, αmax and αmaxapprox, for the exact and approximated case, respectively. The orange shaded area confines the region that can be occupied by a neutron star with MNS = 1.4 M⊙ (see, e.g., Steiner et al. 2013). Note that the y-axis of Beloborodov (2002, Fig. 2) actually begins at Rs/R = 0.01 and not at 0 as implied in their figure.
Current usage metrics show cumulative count of Article Views (full-text article views including HTML views, PDF and ePub downloads, according to the available data) and Abstracts Views on Vision4Press platform.
Data correspond to usage on the plateform after 2015. The current usage metrics is available 48-96 hours after online publication and is updated daily on week days.
Initial download of the metrics may take a while.