


Fig. C.1.
Download original image
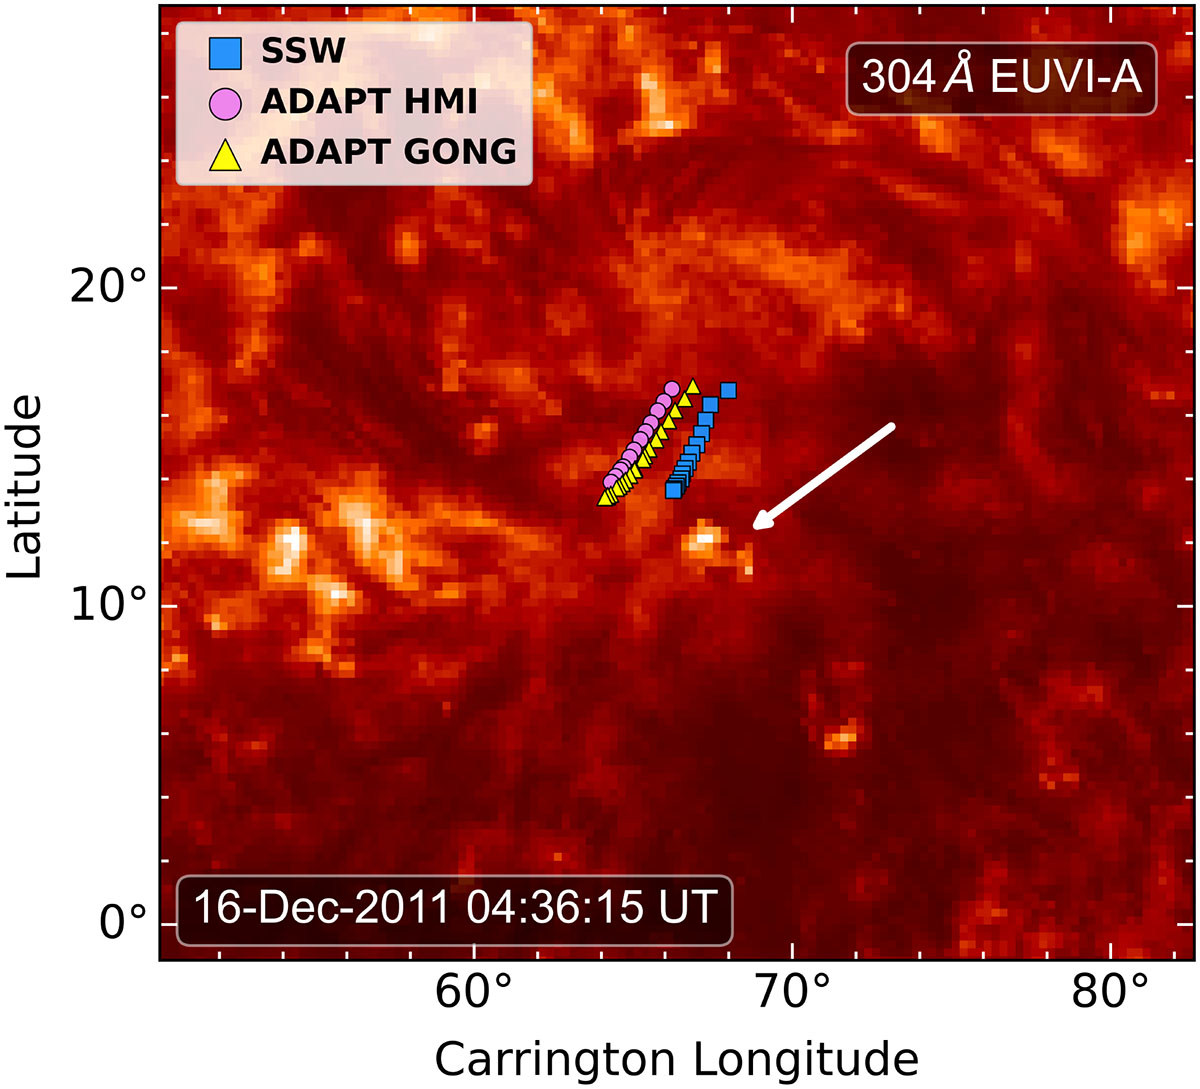
Comparison of footpoint locations for PFSS extrapolations (Rss = 2.5 R⊙ and ℓmax = 88) using SSW (blue squares), ADAPT HMI (pink dots) and ADAPT GONG (yellow triangles) synchronic magnetic maps from December 16, 2011, as the photospheric boundary condition. Although the SSW maps allow for a slightly higher resolution (ℓmax = 94), we adopt ℓmax = 88, i.e., the maximum value permitted by the angular resolution of the ADAPT maps, to ensure a consistent comparison among the three maps. The STEREO-A/EUVI 304 Å image of the brightening on December 16 at 04:36 UT is also shown, with the brightening location marked by the white arrow.
Current usage metrics show cumulative count of Article Views (full-text article views including HTML views, PDF and ePub downloads, according to the available data) and Abstracts Views on Vision4Press platform.
Data correspond to usage on the plateform after 2015. The current usage metrics is available 48-96 hours after online publication and is updated daily on week days.
Initial download of the metrics may take a while.