


Fig. A.1.
Download original image
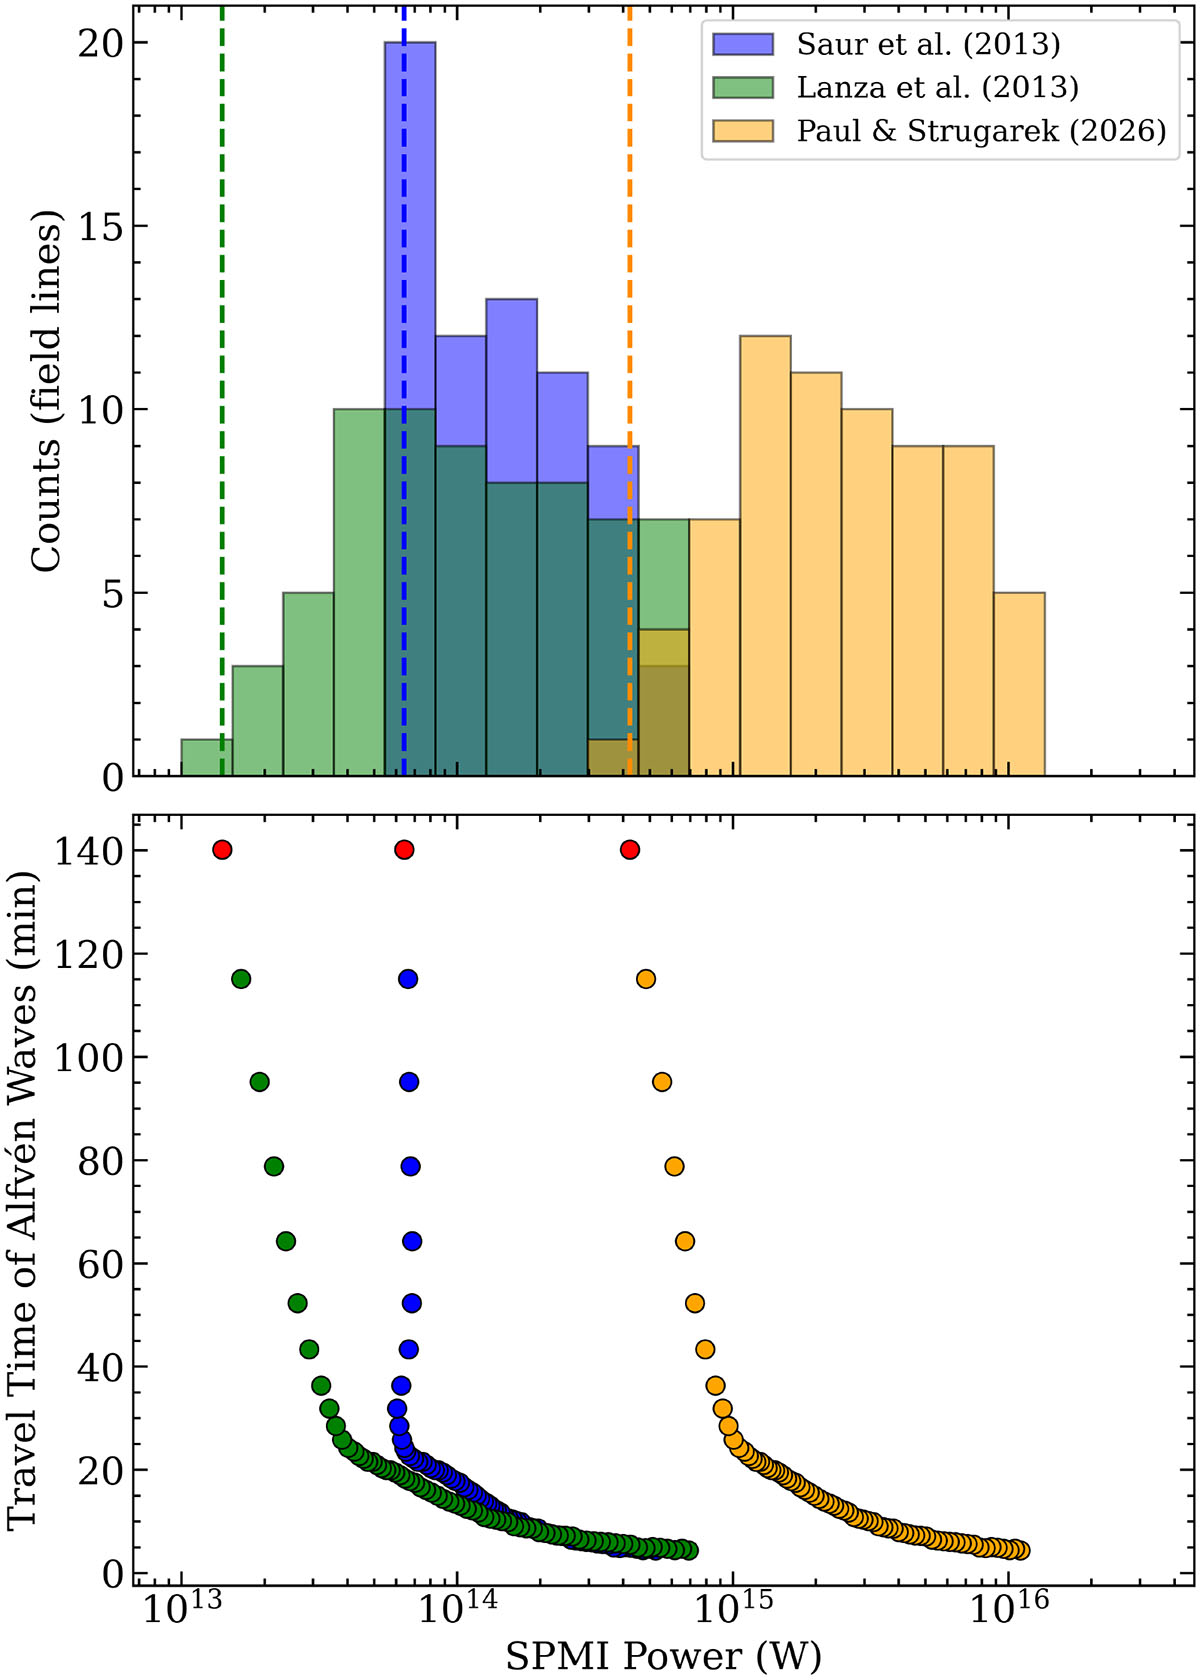
Top: Distribution of SPMI power calculated with the Saur et al. (2013) (blue), Lanza (2013) (green), and Paul & Strugarek (2026) (orange) models for all field lines in Figure 2 whose footpoints lie within 5° of the brightening. The field lines are generated from the minute cadence of the comet’s trajectory. The single-field-line values from Section 2.2 are indicated by vertical dashed lines. Bottom: Propagation time of hypothetical Alfvén waves for each magnetic field line as a function of the associated SPMI power. The red points correspond to the powers labeled with vertical dashed lines in the upper panel.
Current usage metrics show cumulative count of Article Views (full-text article views including HTML views, PDF and ePub downloads, according to the available data) and Abstracts Views on Vision4Press platform.
Data correspond to usage on the plateform after 2015. The current usage metrics is available 48-96 hours after online publication and is updated daily on week days.
Initial download of the metrics may take a while.