


Fig. 2.
Download original image
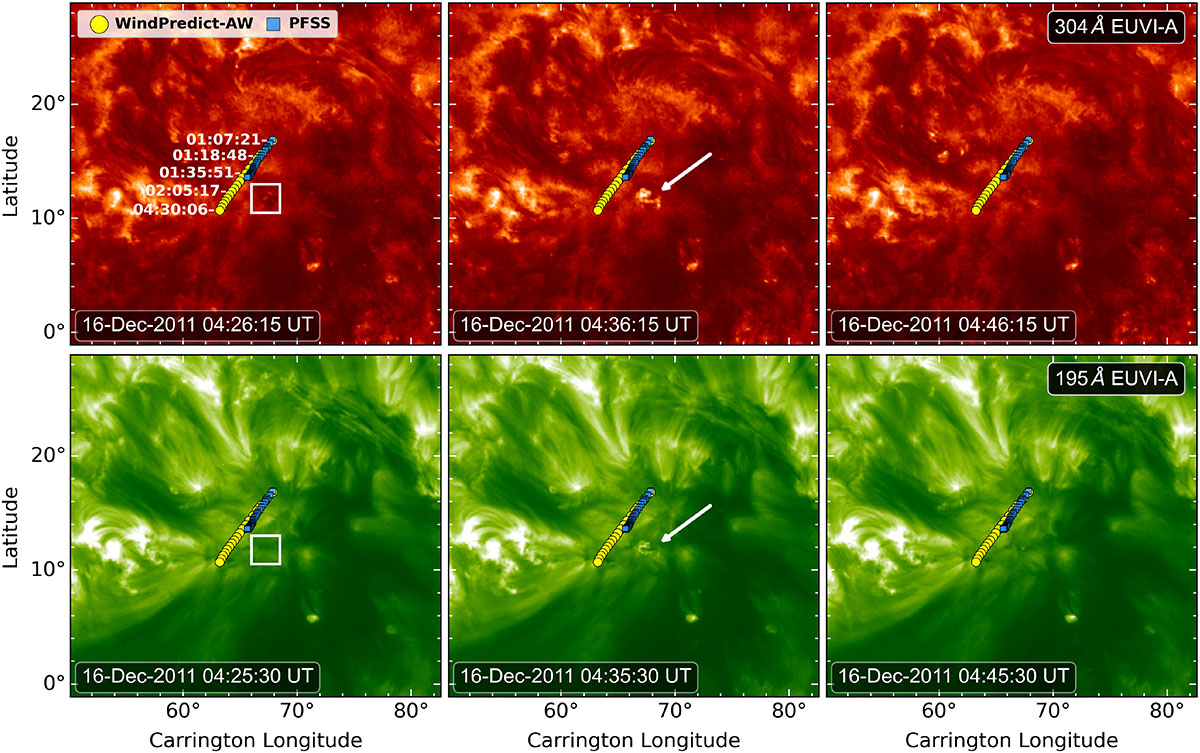
Comparison of the footpoint locations of field lines connecting the comet to the solar surface for different models on December 16, 2011. A SolarSoft synchronic map of the radial magnetic field is used as an input for the PFSS (blue squares) and WindPredict-AW MHD model (yellow dots). Both models use ℓmax = 50. The STEREO-A/EUVI data before (left), during (middle), and after (right) the eruption for the 304 Å (top row) and 195 Å (bottom row) channels are shown. The brightening location is marked by a white arrow in the middle column. In the upper left panel, the time annotations, dated December 16, 2011, correspond to the arrival time at the surface of hypothetical Alfvén waves launched at the site of the comet’s trajectory for different field lines, calculated from the MHD model. The white box in the left column is used to calculate the pre-brightening background intensity in Section 2.2.
Current usage metrics show cumulative count of Article Views (full-text article views including HTML views, PDF and ePub downloads, according to the available data) and Abstracts Views on Vision4Press platform.
Data correspond to usage on the plateform after 2015. The current usage metrics is available 48-96 hours after online publication and is updated daily on week days.
Initial download of the metrics may take a while.