


Fig. 7.
Download original image
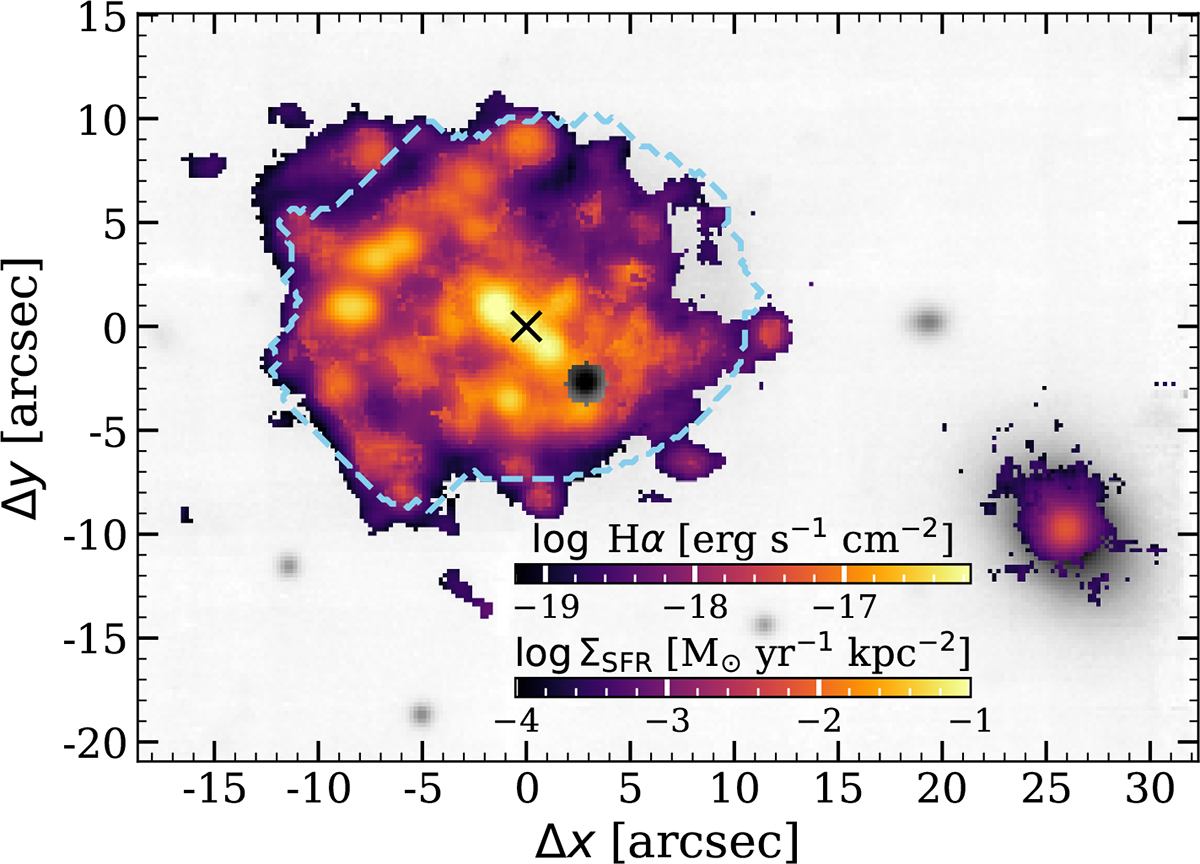
Ionized gas morphology of UG101 and its companion UG101b, traced by rest-frame Hα emission. Flux values have been corrected for dust attenuation (see text), except for UG101b, where Hβ is not detected. Spaxels with (S/N)Hα < 4 have been masked. A second colorbar shows the corresponding levels of surface density SFR (ΣSFR), derived from the Hα emission line shown in the top panel (see text). The black cross marks the galaxy center, and the light blue contour shows the galaxy I-band boundaries (see text).
Current usage metrics show cumulative count of Article Views (full-text article views including HTML views, PDF and ePub downloads, according to the available data) and Abstracts Views on Vision4Press platform.
Data correspond to usage on the plateform after 2015. The current usage metrics is available 48-96 hours after online publication and is updated daily on week days.
Initial download of the metrics may take a while.