


Fig. 6.
Download original image
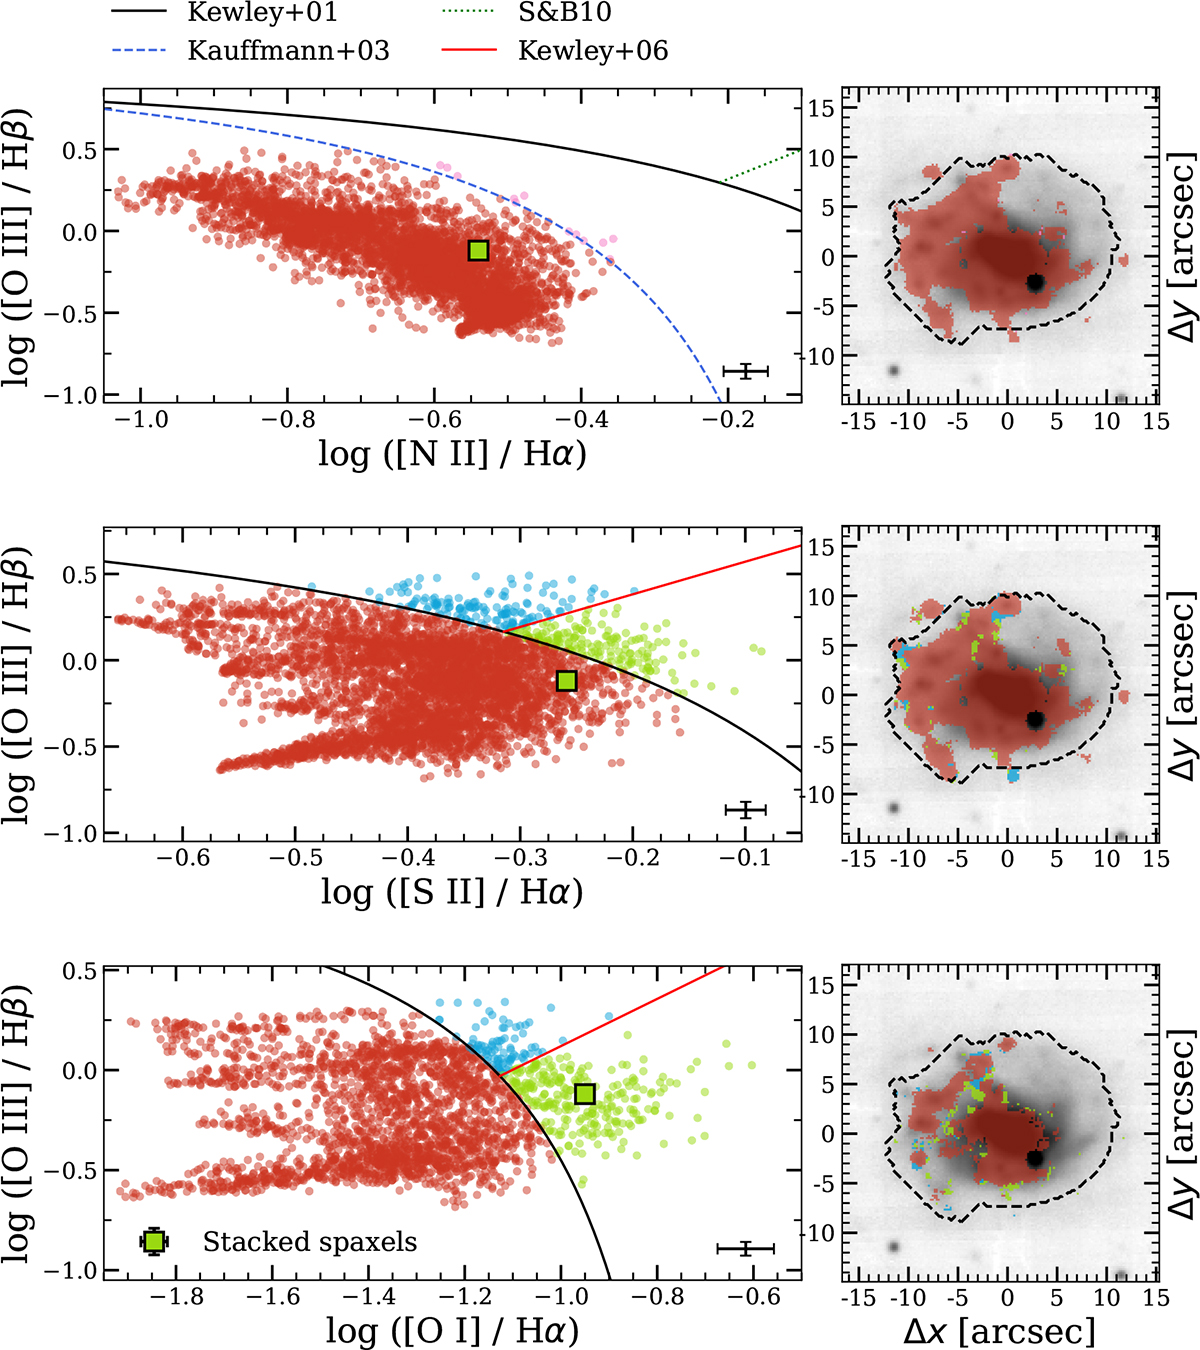
Emission-line diagnostic diagrams of UG101. Left panels: From top to bottom, BPT–[N II], BPT–[S II], and BPT–[O I]. The solid black and red curves correspond to the classification lines introduced by Kewley et al. (2001) and Kewley et al. (2006), respectively. In the BPT–[N II] diagram, the dotted green and dashed blue curves indicate the divisions proposed by Sharp & Bland-Hawthorn (2010) and Kauffmann et al. (2003), respectively. Each point corresponds to an individual spaxel, and only those with S/N ≥ 4 in all required lines are shown. Mean uncertainties in the line ratios are indicated in the bottom-right corner of each panel. The green square shows the position of the stacked spectrum considering all spaxels classified as LINERs in the BPT–[O I] diagram. Right panels: Spatial distribution of spaxels color-coded according to the left-hand diagrams, overlaid on the MUSE white-light image of UG101. Dashed contours indicate the extent of the galaxy main body, for reference.
Current usage metrics show cumulative count of Article Views (full-text article views including HTML views, PDF and ePub downloads, according to the available data) and Abstracts Views on Vision4Press platform.
Data correspond to usage on the plateform after 2015. The current usage metrics is available 48-96 hours after online publication and is updated daily on week days.
Initial download of the metrics may take a while.