


Fig. 5.
Download original image
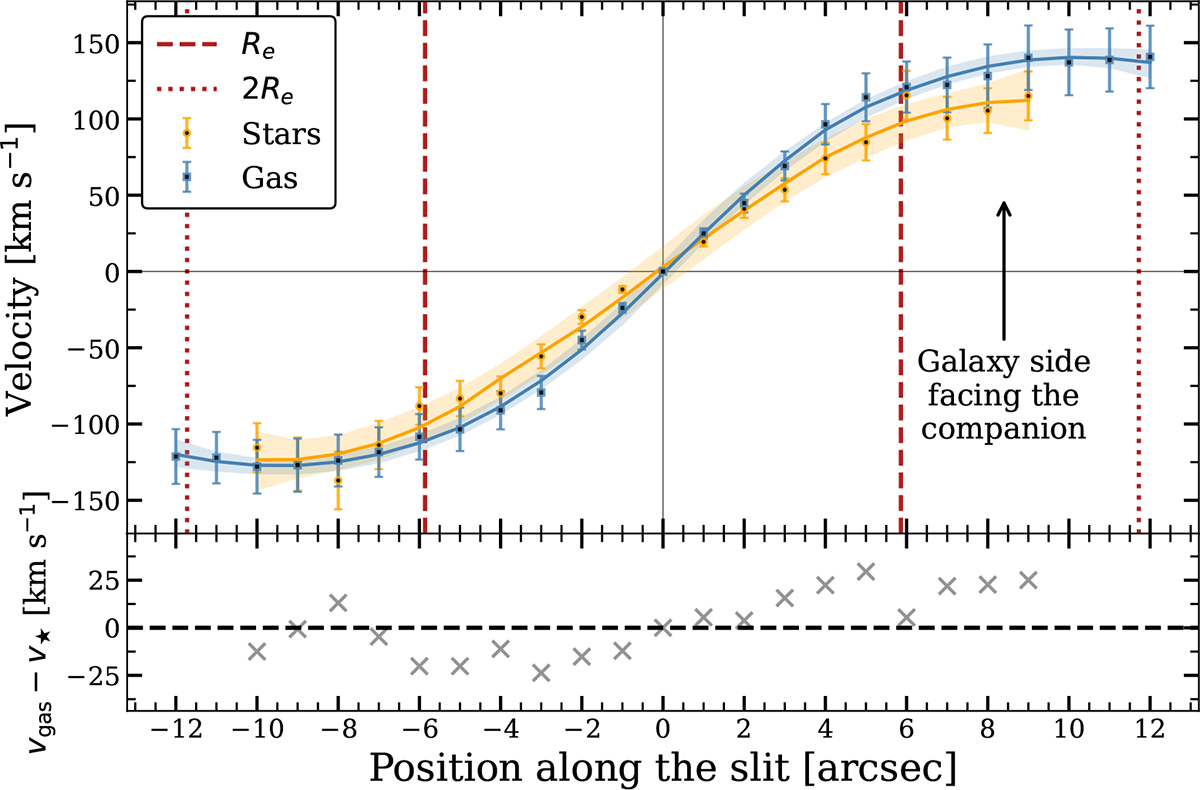
Stellar (orange) and ionized gas (blue) rotation curves in UG101, derived from a slit oriented according to the stellar kinematic PA (see text and also Fig. 7). Points show the average velocities within each slit element, while solid curves correspond to a 1D LOESS local regression (Cappellari et al. 2013), with shaded areas indicating the 3σ uncertainty. The x-axis corresponds to the distance along the slit from the galaxy center, with positive values corresponding to the side facing the companion (indicated in the figure). The dashed vertical lines mark a distance of Re, while the dotted line indicates a distance of 2 Re. The bottom frame shows the difference between gas and stellar velocities.
Current usage metrics show cumulative count of Article Views (full-text article views including HTML views, PDF and ePub downloads, according to the available data) and Abstracts Views on Vision4Press platform.
Data correspond to usage on the plateform after 2015. The current usage metrics is available 48-96 hours after online publication and is updated daily on week days.
Initial download of the metrics may take a while.