


Fig. 4.
Download original image
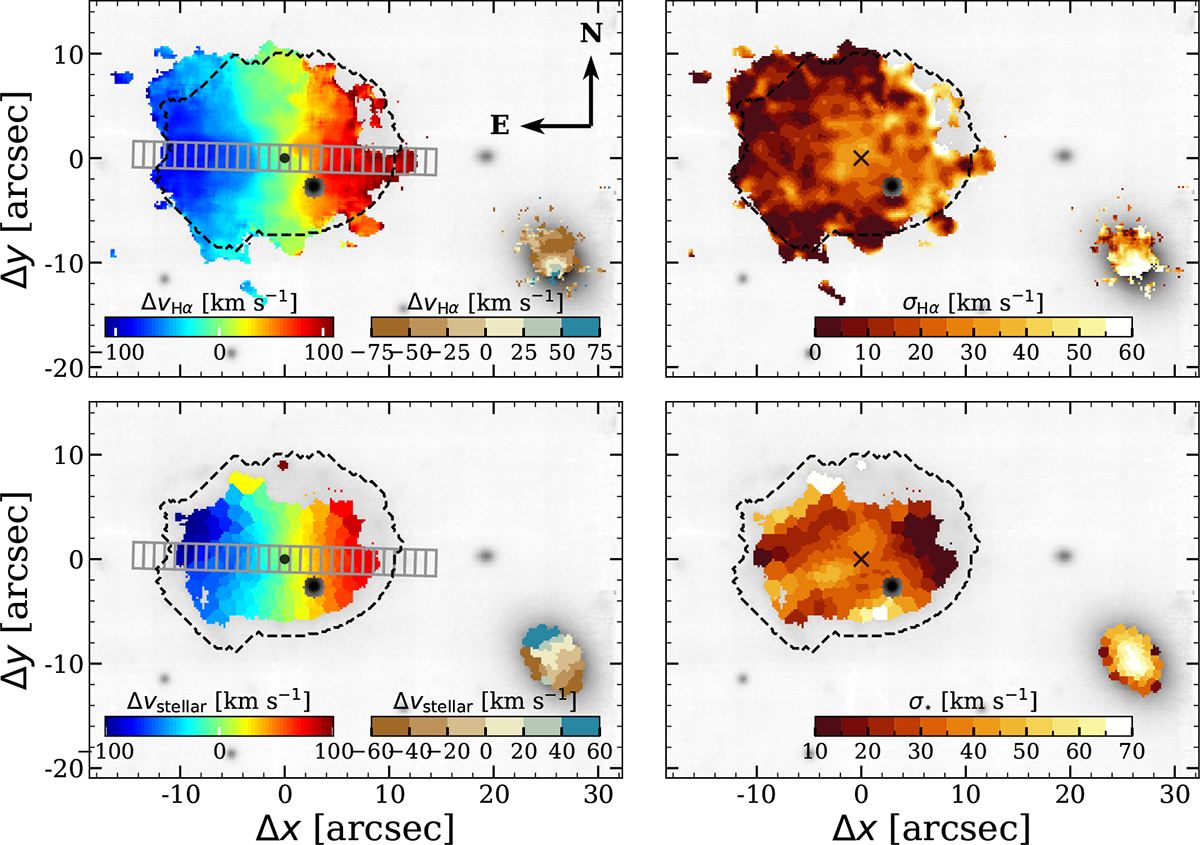
Top-left panel: Ionized gas kinematics of UG101 and UG101b. Only spaxels with (S/N)Hα ≥ 4 are shown, and the systemic velocity of each galaxy is subtracted. In gray, we represent the slit element used to derive rotation curves (see text), which is aligned to the kinematic semimajor axis. Top-right panel: Gas-phase velocity dispersion of both galaxies, traced by their rest-frame Hα emission. Displayed values are corrected for instrumental broadening. Bottom-left panel: Stellar velocity field of both galaxies, derived with PPXF (see text). Bottom-right panel: Stellar velocity dispersion. For better visualization, the stellar velocity and velocity dispersion maps are smoothed using a local weighted regression, as implemented by the LOESS2D Python package (Cappellari et al. 2013).
Current usage metrics show cumulative count of Article Views (full-text article views including HTML views, PDF and ePub downloads, according to the available data) and Abstracts Views on Vision4Press platform.
Data correspond to usage on the plateform after 2015. The current usage metrics is available 48-96 hours after online publication and is updated daily on week days.
Initial download of the metrics may take a while.