


Fig. B.1.
Download original image
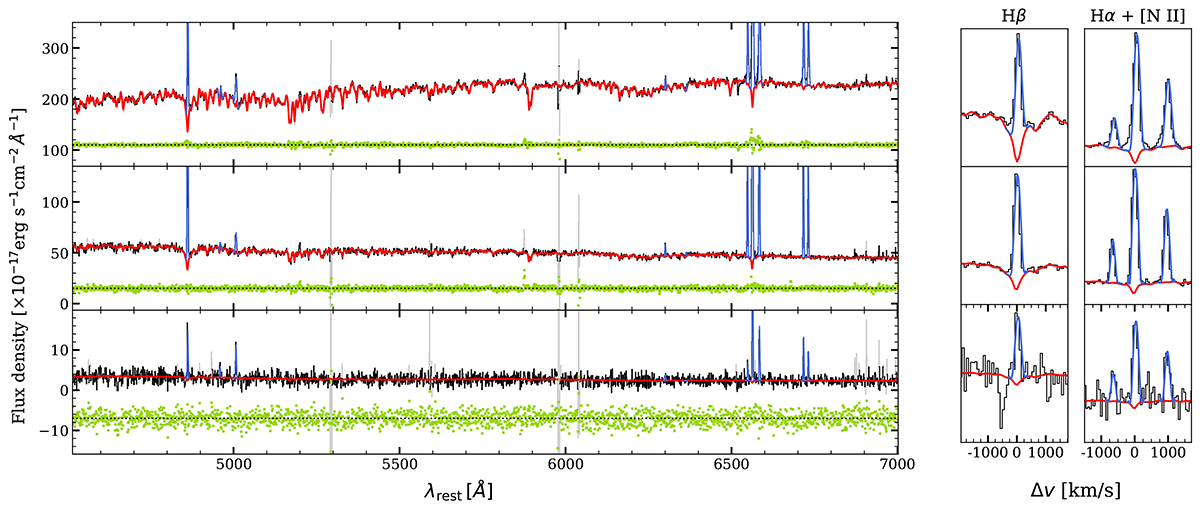
Example of three different spectra in UG103. Top panel: Observed spectrum (black curve) at the galaxy center. The red curve displays the PPXF best fit at the spaxel resolution. The emission-line features modeled with IFSCUBE are shown in blue. Middle panel: Similar to the top panel but showing a spectrum slightly offset from the galaxy center. The red curve corresponds to the PPXF best-fit stellar emission rescaled from the Voronoi bin to the spaxel resolution. Bottom panel: Same as other panels, but now corresponding to the brightest spaxel of a SF clump distant from the galaxy center that does not meet the imposed S/N ≥2 criterion in the continuum and is therefore excluded from the Voronoi binning scheme. In the absence of a PPXF solution, the continuum is modeled using a moving median filter (red curve). In all panels green points show the fit residuals, scaled by the spectral variance. An arbitrary shift has been applied for clarity, and the dotted black line marks the position at which the modeled and observed spectra are identical. Light gray spectral regions flag the presence of sky residuals. Right panels: Zoomed-in view of Hβ and Hα + [N II] emission-line features.
Current usage metrics show cumulative count of Article Views (full-text article views including HTML views, PDF and ePub downloads, according to the available data) and Abstracts Views on Vision4Press platform.
Data correspond to usage on the plateform after 2015. The current usage metrics is available 48-96 hours after online publication and is updated daily on week days.
Initial download of the metrics may take a while.