


Fig. 2.
Download original image
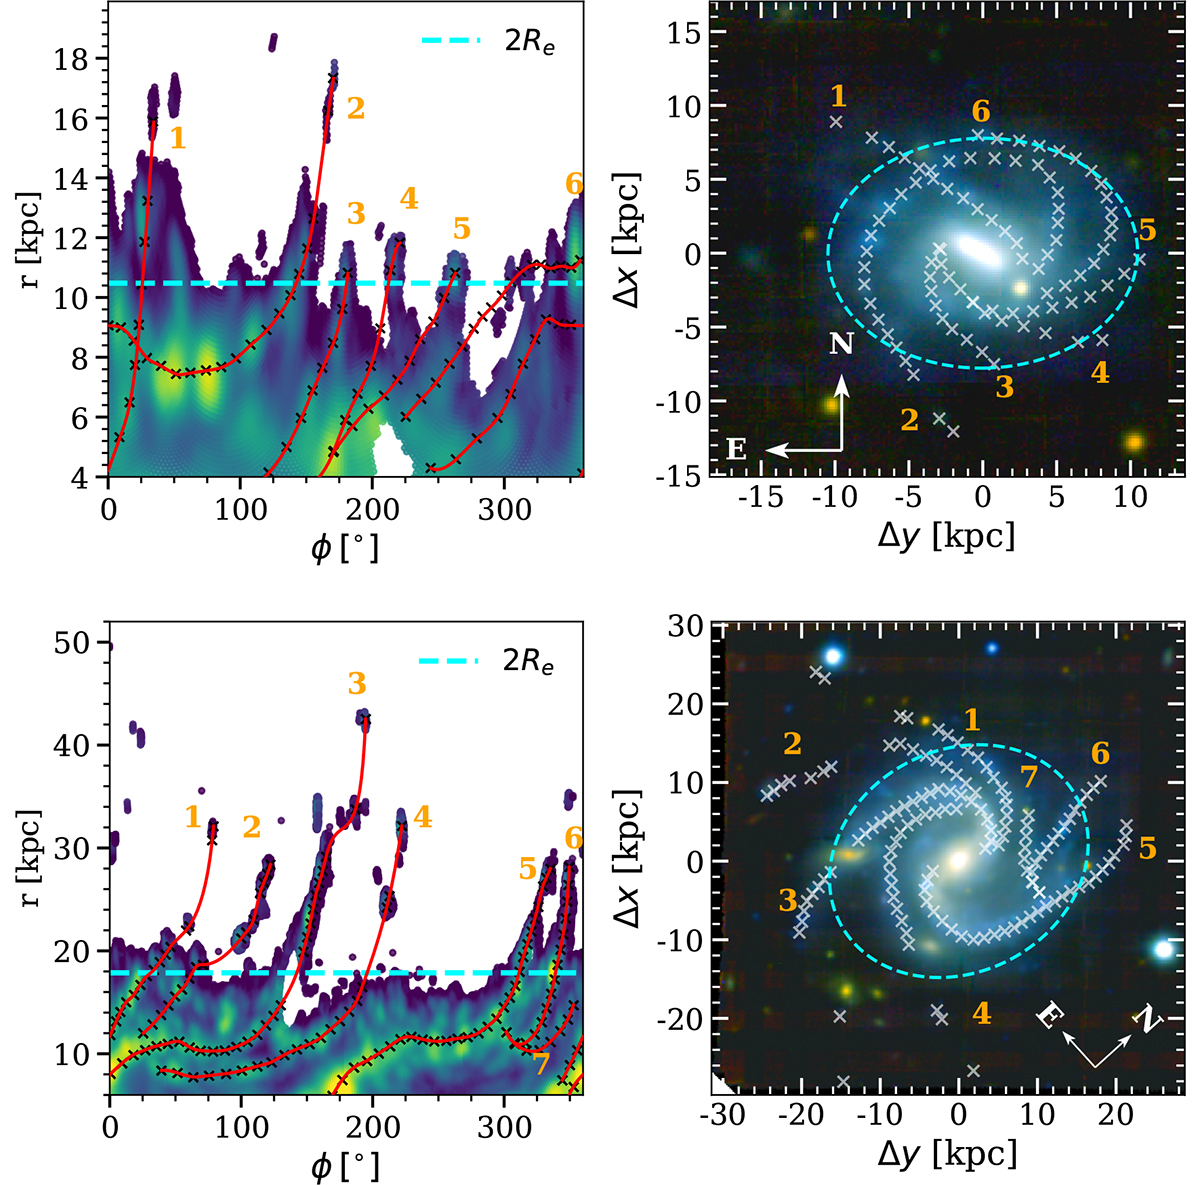
Left panels: Deprojected Hα emission-line maps of UG101 (top) and UG103 (bottom), in polar coordinates. The angular coordinate (ϕ) starts from the north direction and increases counterclockwise. Only spaxels with S/N ≥ 4 are displayed, and stars are masked. Positions are marked along the spiral arms of each galaxy (“x” marks). The inclination of the curve connecting these points was computed to measure the pitch angle of each spiral arm, and the red curves show the smoothed fit. The horizontal cyan line marks 2 Re. Right panels: Color-composite images of each galaxy with re-projected positions overlaid to highlight the unwound spiral arms. The dashed cyan line shows the elliptical isophote with a semimajor axis equal to 2 Re. In all panels, the orange text marks the labels assigned to each identified spiral arm.
Current usage metrics show cumulative count of Article Views (full-text article views including HTML views, PDF and ePub downloads, according to the available data) and Abstracts Views on Vision4Press platform.
Data correspond to usage on the plateform after 2015. The current usage metrics is available 48-96 hours after online publication and is updated daily on week days.
Initial download of the metrics may take a while.