


Fig. A.1.
Download original image
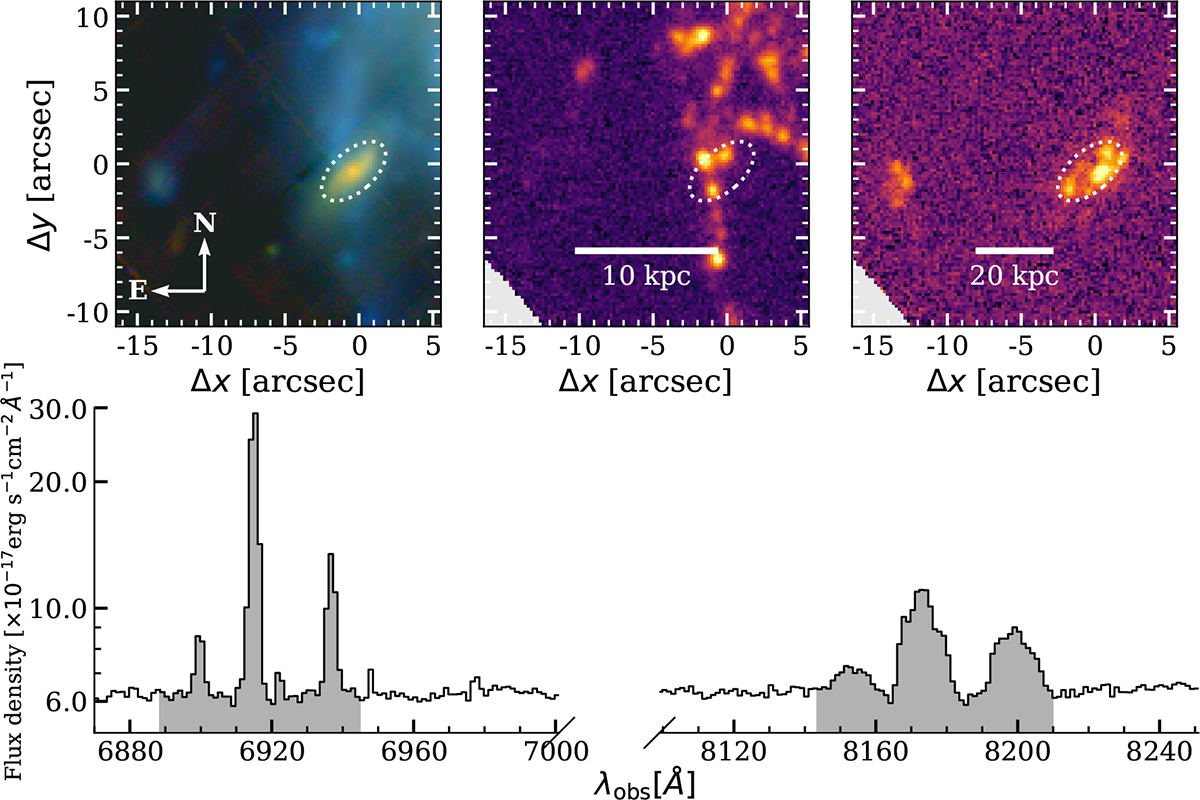
Top panels: Zoom-in on the MUSE color-composite image of UG103 highlighting the elongated background source, enclosed by the dashed white ellipse. The middle and right panels show flux maps integrated around each Hα + [N II] complex. Physical scale bars are adapted according to the redshifts of the main and background galaxies. Bottom panel: MUSE spectra integrated within the dashed white ellipse, zoomed in both Hα + [N II] complexes. Shadowed regions indicate the wavelength ranges used to produce the middle and right images.
Current usage metrics show cumulative count of Article Views (full-text article views including HTML views, PDF and ePub downloads, according to the available data) and Abstracts Views on Vision4Press platform.
Data correspond to usage on the plateform after 2015. The current usage metrics is available 48-96 hours after online publication and is updated daily on week days.
Initial download of the metrics may take a while.