


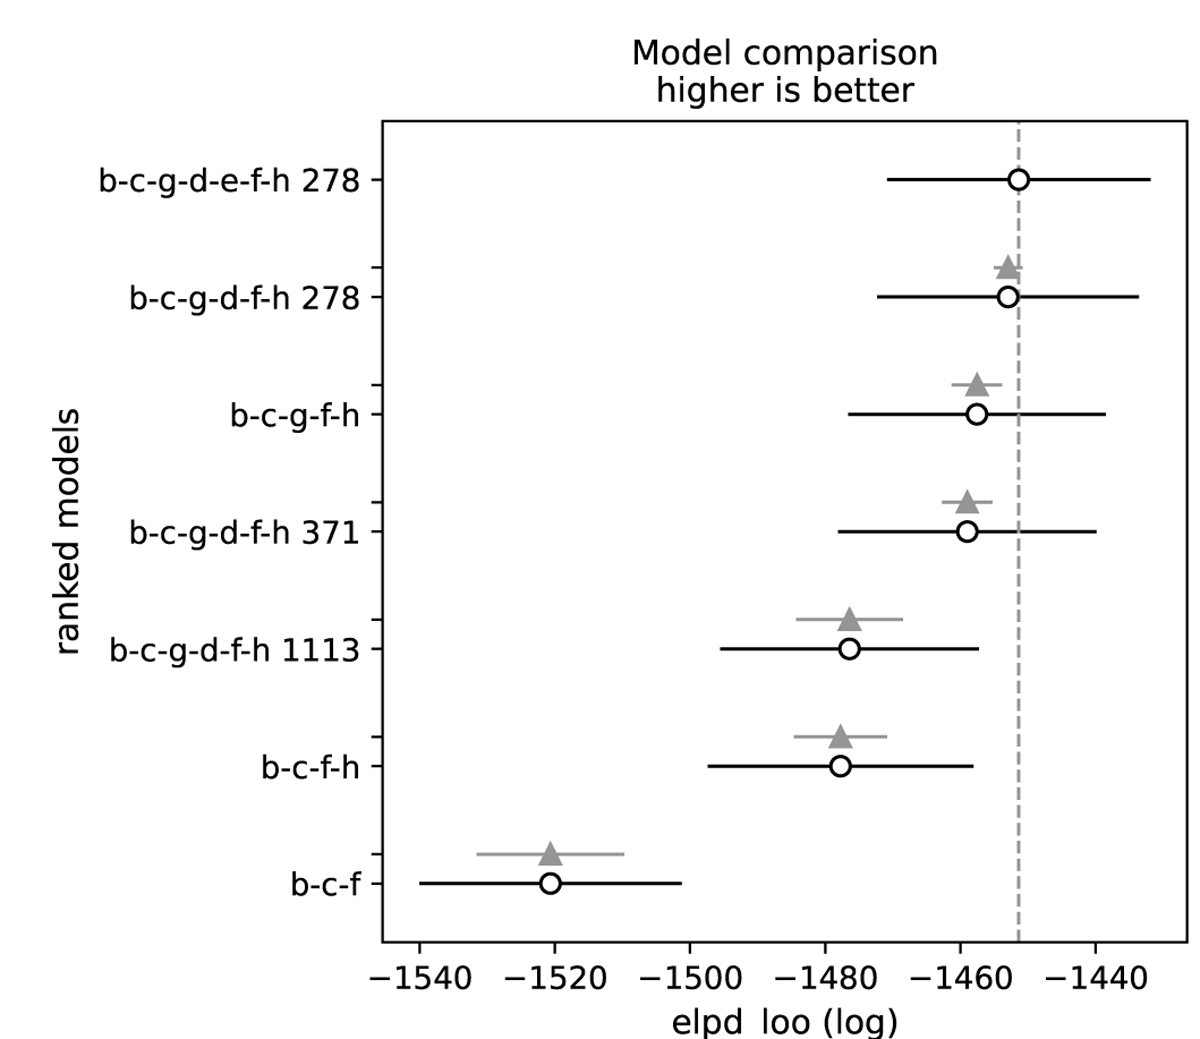
Fig. 4
Download original image
Comparison of different RV models, including subsets of the HIP 41378 planets, ranked by their expected log point-wise predictive density (elpd LOO). Each model label indicates the included planets and, for planet d, the tested orbital period in days. Higher elpd LOO values correspond to better out-of-sample predictive performance. The horizontal line segments represent the standard error of the elpd. The lighter line segment with triangles indicates the elpd difference of one model relative to the best model.
Current usage metrics show cumulative count of Article Views (full-text article views including HTML views, PDF and ePub downloads, according to the available data) and Abstracts Views on Vision4Press platform.
Data correspond to usage on the plateform after 2015. The current usage metrics is available 48-96 hours after online publication and is updated daily on week days.
Initial download of the metrics may take a while.