


Fig. G.1
Download original image
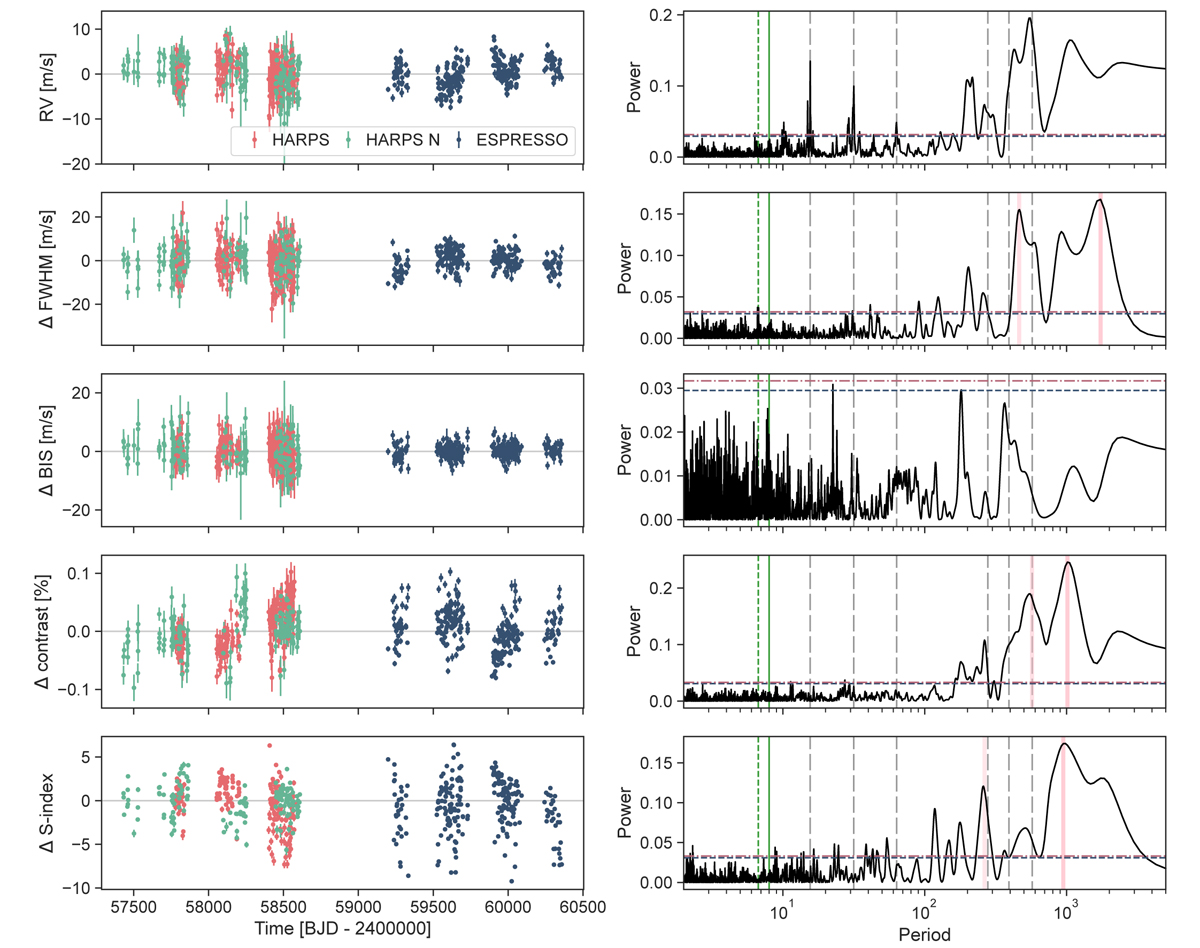
Time series and GLS periodograms of RVs and stellar activity indicators for HIP 41378 from HARPS, HARPS-N, and ESPRESSO. From top to bottom: RVs, FWHM, BIS, CCF contrast, and S-index. Periods of planets b, c, g, d, e and f are shown as grey dashed lines. Stellar rotation periods from photometry and ![Mathematical equation: $\[\log \left(R_{\mathrm{HK}}^{\prime}\right)\]$](/articles/aa/full_html/2026/06/aa59666-26/aa59666-26-eq68.png) are indicated as green dotted and solid lines, respectively. Maximum power periods are shown as dark pink lines, with aliases in light pink. False-alarm probabilities at 1% and 10% are indicated with horizontal lines.
are indicated as green dotted and solid lines, respectively. Maximum power periods are shown as dark pink lines, with aliases in light pink. False-alarm probabilities at 1% and 10% are indicated with horizontal lines.
Current usage metrics show cumulative count of Article Views (full-text article views including HTML views, PDF and ePub downloads, according to the available data) and Abstracts Views on Vision4Press platform.
Data correspond to usage on the plateform after 2015. The current usage metrics is available 48-96 hours after online publication and is updated daily on week days.
Initial download of the metrics may take a while.