


Fig. E.1
Download original image
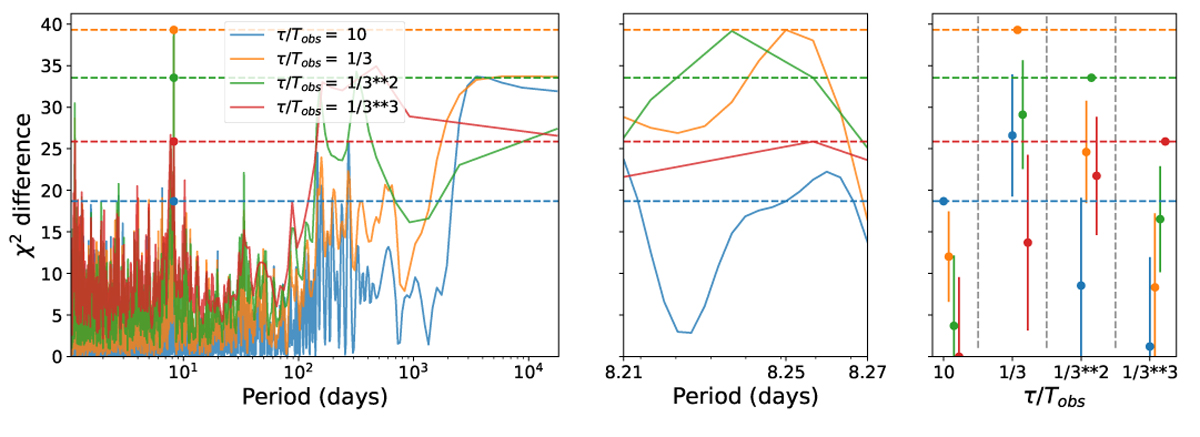
Apodized sine periodogram of the RV data, including offsets, transiting planets, and order 11 polynomial in the base model. Left: apodized periodogram for different apodization timescales, that is Eq. (E.1) for τ = 10Tobs (blue), Tobs/3 (orange), Tobs/9 (green) and Tobs/27 (red), denoting by Tobs the observation timespan of the data. Horizontal dashed lines represent the value of the ASP at the period corresponding to the global maximum (here attained for τ = Tobs/3 Middle: zoom around the maximum peak. The right panel represents a statistical test: assuming the true value of the timescale given in the x axis, the circles represent the expected value of the peaks corresponding to other timescales, the error bar represent the standard deviation. For instance, assuming τ = 10Tobs is the true timescale, we would expect an apodized sine with τ = Tobs/3 to have a χ2 difference of ≈ 12 ±5, which is 5.4 σ away from the measured value (39, orange dashe line). The error bars are horizontally shifted to improve the readability of the figure, but they correspond to the same assumed timescale.
Current usage metrics show cumulative count of Article Views (full-text article views including HTML views, PDF and ePub downloads, according to the available data) and Abstracts Views on Vision4Press platform.
Data correspond to usage on the plateform after 2015. The current usage metrics is available 48-96 hours after online publication and is updated daily on week days.
Initial download of the metrics may take a while.